Reference no: EM131450812
Part A -
Q1. Here are five scatterplots and two tables. Table A contains r-value of the data in the five scatterplots. Table B contains equations of the least-squares line for the five data sets. In each table, enter the letter of the matching scatterplots below each r-value or equation.
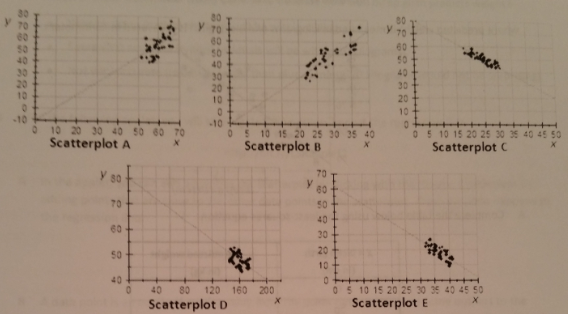
Table A (r-value)
|
-0.54
|
-0.73
|
0.45
|
-0.95
|
0.88
|
|
|
|
|
|
|
Table B (equations of the least-squares lines):
|
y^ = -10.5 + 2x
|
y^ = 62 - 1.2x
|
y^ = -10.5 + 1.1x
|
y^ = 80 - 1.2x
|
y^ = 80 - 0.2x
|
|
|
|
|
|
|
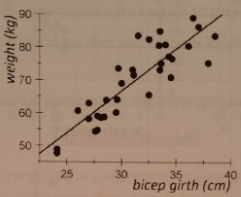
Q2. Based on data from 34 adults who exercise regularly, the least-squares regression line for the relationship between bicep girth (the length in centimeters around the upper arm) and the person's weight is:
predicted weight = 2.6 · bicep girth - 10.5
where predicted weight is measured in kilograms and bicep girth is measured in centimeters.
A. Complete the table below using the least-squares equation.
|
x = bicep girth (in cm)
|
y^ = predicted weight (in kg)
|
|
0
|
|
|
20
|
|
|
25
|
|
|
33
|
|
|
45
|
|
B. In the least-squares regression equation, when x = 0, the initial value is -10.5. Does this number, -10.5, mean anything about bicep girth or predicted weight? Why or why not?
C. Explain the meaning of the slope of the regression equation. Tell how the slope relates a person's bicep girth to his or her predicted weight.
D. If the bicep girth of an adult increased by 3 cm, how would that person's predicted weight change?
E. Which of these statements would you use to describe how well bicep girth predicts weight?
- Very accurate (typical residuals will be within a kilogram).
- Somewhat accurate (typical residuals will be within 10 kilograms).
- Not very accurate (residuals larger than plus or minus 20 kilograms would not be surprising).
Q3. With the following applet, you will investigate how outliers impact the regression line.
https://bit.ly/LSRapplet2
A. In the applet, you can add a point to the scatterplot by clicking with the mouse. Experiment by adding points that are close to the other data points in the scatterplot. Describe what happens to the regression line.
B. A data point is an outlier if it is far away from the other data points. Add some outliers to the scatterplot. In other words, add points that are far away from the other data points. Describe what happens to the regression line.
C. What happens to the correlation coefficient, or r-value, when you add points that are outliers? Explain your understanding of why this happens.
Part B -
Q1. At Los Medanos College, a statistics instructor posted the following information on her office door at the end of the semester:
|
Statistics FA 2010
|
Mean
|
Standard Deviation
|
Correlation
|
|
Pre-final exam average
|
75
|
8
|
0.7
|
|
Final exam score
|
78
|
12
|
A. Final course grades have not been posted. Karen wants to use a least-squares regression line to predict her final exam score based on this information. What is the slope of this line?
B. What is the initial value of this line (the y-intercept)?
C. Give the equation of the least-squares regression line.
D. Karen has an 82 pre-final exam average. What does the least-squares line predict for Karen's final exam score?
E. Is it safe to assume that that the correlation coefficient guarantees a linear relationship between the pre-file averages and final exam scores? Explain your answer.
F. What could we do to ensure that a linear model is appropriate?
Q2. In this lesson, you learned that the point (x-, y-) is on a least-squares regression line. Thus, if x = x-, then y^ = y-. Explain in words what this means.
Part C -
For Questions 1-3, match each description to one of the scatterplots below and briefly explain your reasoning. Then identify what a single point on the plot represents.
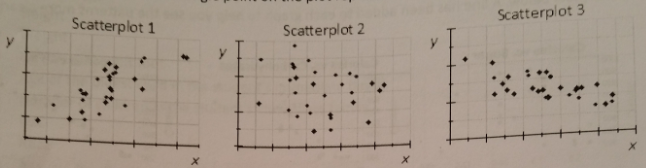
Q1. x = average outdoor temperature and y = heating costs for a residence for winter days.
A. The match for this is scatterplot number _____ because:
B. What does a single point on the plot represent?
Q2. x = height (inches) and y = shoe size for adults.
A. The match for this is scatterplot number _____ because:
B. What does a single point on the plot represent?
Q3. x = height (inches) and y = score on an intelligence test for teenagers.
A. The match for this is scatterplot number ____ because:
B. What does a single point on the plot represent?
Q4. Suppose that a group of researchers gathered data about the amount of three nutrients - fat, sugar, and carbohydrates - in 20 fast food hamburgers. The researchers gathered the information from fast food companies' website. To keep measurements consistent, all data was described in grams. Using the companies' website, the researchers also identified the number of calories in each hamburger. The researchers wanted to know whether there was a relationship between calories and the amount of fat, sugar, and carbohydrates in a hamburger. The data about calories and nutrients is presented in the scatterplots below. A line has been added to each graph to help you see the patterns more clearly.
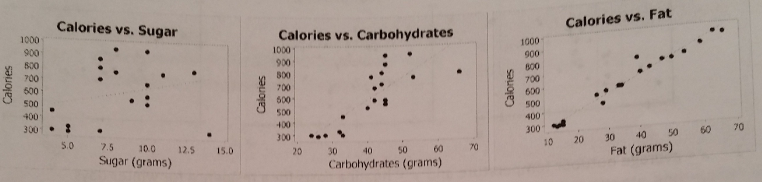
A. About how many calories would you predict for a burger that has 20 grams of fat?
B. About how many calories would you predict for a hamburger that has 40 grams of carbohydrates?
C. Which prediction is likely to be more accurate? Why do you think this?
D. Which nutrient has the weakest impact on calories? Why do you think this?
E. What does the idea of strength tell you about whether a nutrient is a good predictor of calories?
F. What is the direction of the fat/calories graph? What does the direction of the line tell you about the association between the amount of fat and the calories in fast food hamburgers?
Q5. Suppose you gathered the following information from students at a local high school:
- GPA (grade point average)
- Average weekly hours spent working at a job
- Average weekly hours spent doing homework
- Average hours of sleep a night
- Hourly wage
- Height
- Weight
- Length of the left foot
- Age of the oldest child in the student's immediate family
- Number of children in the student's immediate family
- Sex
- Race
- Age
For each question below, identify variables from the list above that fit the requirements, and explain why you selected them (you may use the same variable for more than one answer):
A. Identify two variables that you think will show a positive linear association, and explain your reasoning.
B. Identify two variables you think will show a negative linear association, and explain your reasoning.
C. Identify two variables you think will not show an association in a scatterplot, and explain your reasoning.
Q6. Sketch a scatterplot to illustrate each of the three relationships that you described in Question 5. Draw three scatterpl(its showing imaginary data for 12 students to illustrate the association.
- If there is an association, sketch a line to highlight the association.
- For each scatterplot, label the axes of each graph with the name of the variable.
- Scale the graph (that is, place number measurements on the x and y axes). Make sure that the numbers are realistic for the variable (that is, the numbers are what you would see if the problem were real and not imaginary).
- Remember to place the explanatory variable on the horizontal axis and place the response variable on the vertical axis.
A. Positive linear association scatterplot:
B. Negative linear association scatterplot:
C. No association scatterplot:
Part D -
Q1. Use the applet at https://bit.ly/CorrGuess1 for this question.
A. Match the values of the correlation coefficient with the corresponding scatterplot. Use what you know about strength and direction of linear associations to complete this task.
B. Click Answers to check your work.
C. Click New Plots for a new set of scatterplots. Just below the plots, the applet keeps a running count of how many correct matches you have made. Continue matching scatterplot and correlation coefficients until you have accumulated (gathered) at least 25 correct matches.
Q2. Use the applet at https://bit.ly/CorrGuess2 for this question.
A. Click on the New Sample button, which generates a scatterplot.
B. Type in your guess for the correlation in the box called Correlation Guess and hit Enter. The applet then reveals the actual value of the correlation coefficient.
It is not easy to guess the value of the correlation coefficient exactly. If a guess is within 0.2 of the actual value, it is a pretty good guess. (For example, if you guess 0.7 and the actual value is anything between 0.5 and 0.9, you have a pretty good guess.)
C. Click New Sample and estimate the correlation as many times as it takes for you to be comfortable with your ability to estimate the value of the correlation coefficient within 0.1.
Q3. John Allen Paulos also wrote a series of articles for ABCNews.com called Who's Counting? In his February 1, 2001 column, Paulos discussed the idea that correlation does not imply causation. He pointed out that the consumption (drinking) of hot chocolate is negatively correlated with crime rate. However, it should be obvious that drinking more hot chocolate does not lower the crime rate.
For this situation, assume that the data describe large cities in the United States.
A. What is the explanatory variable?
B. What is the response variable?
C. Identify a possible confounding (or lurking) variable in this scenario.
Part E -
Q1. For this problem, we return to the data for the 76 breakfast cereals we investigated at the beginning of Module 3.
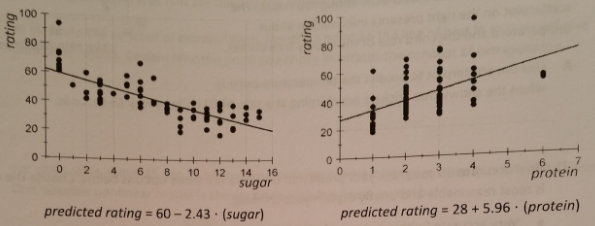
Imagine that two new cereals are being rated by Consumer Reports. Cereal A has 10.5 grams of sugar in a serving and Cereal 8 has 2.5 grams of protein in a serving.
A. Use the equations of the lines of best fit to predict the Consumer Reports rating for the two cereals.
B. For which cereal do you think your prediction is probably more accurate? That is, for which cereal do you think your prediction is likely be closer to the actual Consumer Reports rating? Why?
Q2. Can we predict the temperature based on how fast crickets chirp?
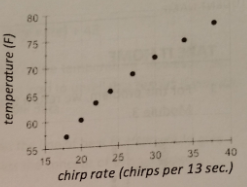
Crickets chirp by rubbing their wings together. According to scientist Tom Walker, crickets are good thermometers because their chirp rate is related to temperature. The snowy tree cricket chirps at a rate that is slow enough to count. The scatterplot on the right presents information about temperature and the chirp rate of the snowy tree cricket temperature and the chirp rate of the snowy tree cricket.
A. Use the scatterplot to predict the temperature outside when the snowy tree crickets are chirping at a rate of 40 chirps every 13 seconds.
B. How accurate do you think your prediction is? There are three options below. Choose the option that is most reasonable and briefly explain your thinking.
- Very accurate (within a range of plus or minus 1 degree).
- Somewhat accurate (within a range of plus or minus 5 degrees).
- Not very accurate (within a range of plus or minus 10 degrees).
C. This is the same data graphed over a wider field of view, like zooming out on a photograph. The window has been enlarged by expanding both axes.
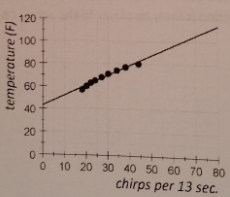
The line pictured is the line of best fit:
Predicted temperature = 0.88 · (chrip rate) + 43
For some chrip rates, this line gives very accurate predictions of the temperature. However, the data are actually slightly curved. Using the line of the best fit may then lead to unreliable results if you are predicting temperatures that are outside the range of available data.
To illustrate the concept of extrapolation, identify a point on the line of best fit that would give unreliable results. Explain how the point you chose illustrates the concept of extrapolation.
D. For chirp rates above 45 per 13 seconds, a nonlinear model might give more accurate predictions. One possible nonlinear model is shown along with the linear model below.
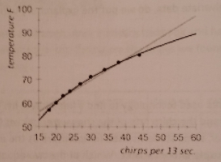
Predict the temperature for a chirp rate of 55 per 13 seconds using both the linear model and the curved model. What is the difference in temperatures predicted by the two models?
Q3. We learned that a variable that is used to predict the value of another variable is called an explanatory variable. The other variable, whose values we are predicting, is called the response variable.
A. The introductory problem in this lesson discussed forearm lengths and heights for 20 female college students. In this situation, which is the explanatory variable?
B. The cereal data includes the amount of sugar in a serving and the Consumer Reports rating. In this situation, which is the explanatory variable?
C. When graphing bi-variate data, do we put the explanatory variable on the horizontal axis or the vertical axis?
D. A group of students used technology to find a line of best fit. They used measurements of temperature (*F) and the chirp rate of the snowy tree cricket (measured as number of chirps in 13 seconds). However, some students used temperature as the explanatory variable, and others used chirp rate as the explanatory variable. Which of the two equations below treats temperature as the explanatory variable? Circle your choice.
predicted temperature = 0.88 · (chirp rate) + 43
predicted chirp rate = 1.1 · (temperature) - 47
Part F -
Q1. The table on the right contains data collected from students at Los Medanos College in 2009. The variable, credits, is the number of credits each student took during particular semester. The variable, textbooks, is the amount of money On dollars) that students spent on the textbooks that were required for their courses that semester, the credits and textbooks data come from student reports on a survey.
|
Credits
|
Textbooks
|
|
3
|
120.25
|
|
4
|
65.95
|
|
9
|
465.00
|
|
12
|
430.00
|
|
14
|
396.50
|
|
16
|
475.00
|
|
8
|
208.00
|
|
1
|
5.00
|
|
6
|
49.10
|
|
15
|
658.00
|
|
9
|
220.00
|
|
4
|
172.00
|
|
12
|
502.00
|
|
12
|
460.12
|
|
12
|
530.00
|
A. Use technology to find the least-squares regression (LSR) line. (Think carefully about which variable is explanatory.)
B. Use the LSR line to predict the amount spent on textbooks for a student taking 12 units.
C. Explain why the LSR line is considered the line of best fit.
Q2. The link below has an applet. With the applet, you can draw a line that you think fits data. Then compare your line to the least-squares regression line.
https://bitly/LSRapplet
Follow the instructions below.
A. Instructions
i. Check Your line and click Move line. Follow directions to visually fit the line to the data.
ii. Check Show squared residuals and record the SSE for your line in the table.
iii. Check Regression line.
iv. Check Show squared residuals and record the SSE for the regression line in the table.
|
Line Predicting Height Based on Foot Length
|
Equation of Line
|
SSE
|
|
Your line:
|
|
|
|
Regression line:
|
|
|
B. Compare the values of the cSE for your line with the SSE of the regression line. Is the SSE for your line greater than, less than, or equal to the SSE of the regression line? Why does this make sense?
C. When you click Show residuals, you see vertical line segments drawn from each data point to the regression line.
1) Some line segments are long and others are short. Why is this?
2) Why do you think these vertical line segments are shown? That is why might these line segments be helpful to see?
D. When you click Show squared residuals, you see squares appear.
1) Some squares are small and others are large. Why is this?
2) Why do you think these squares are shown?
Part G -
Q1. The Environmental Protection Agency picks the 10 most fuel-efficient cars each year. The scatterplot on the right shows the engine size (measured in liters) and highway miles per gallon (mpg) rating of the EPA's top nine cars of 2011. Note that cars with bigger engines usually get fewer miles per gallone.
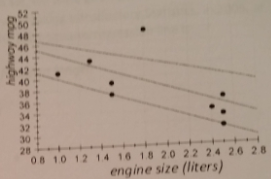
The equation ofg three lines in graph are:
a. y^ = 46 - 6x
b. y^ = 50 - 6x
c. y^ = 50 - 4x
A. Label each line with the letter of the correct equation (a, b, or c).
B. One of the lines is the line of best fit. Write the equation for the line of best fit, below. Briefly explain how you made your decision.
C. What is the slope of the line that you chose? What does the slope tell you about the relationship between engine size and highway miles per gallon?
D. What is the y-intercept of the line that you chose? Intercept the y-intercept in the context of this problem. Explain why your interpretation does or doesn't make sense for this problem.
Assignment Files -
https://www.dropbox.com/s/r6u5zgugatgkd10/all%20files.zip?dl=0