Explain difference between classification and prediction

Assignment Help Applied Statistics
Reference no: EM132312523

Business Analytics Assignment -

Q1. Carefully Read the "CommBank Retail Business Insights Report FY18" provided with this as an attachment and answer the below questions.

i. Comment on the insights report based on the overall features; including the quality of visualisations, presentability, and the information provided.

ii. List the key information you derive from this insights report and explain how they will be useful in decision making.

iii. Write an abstract (one paragraph) summarising the insights report.

iv. Suggest improvements to this insights report.

Q2. Regression analysis is a commonly used technique to find relationships among variables. Answer the below questions based on regression analysis.

i. Provide an example where regression analysis can be effectively used.

ii. Collect height and weight data from 10 friends/relatives of yours and complete the below table. Every student in class should have a unique set of values.


Height

Weight

1


2


3


4


5


6


7


8


9


10


iii. Draw a scatterplot based on above data. Based on your plot comment on the relationship between height and weight.

iv. Compute the equation of the regression line.

v. Calculate the R2 value and comment on the goodness of the fit.

vi. Use an analytics tool of your choice to calculate the values for iv, and v. Compare them with your answer.

Q3 Classification and regression are commonly used processes in business analytics.

i. Briefly explain the difference between classification and prediction.

ii. Give examples for classification methods you know.

iii. The following diagram shows a neural network with one hidden layer.

1468_figure.png

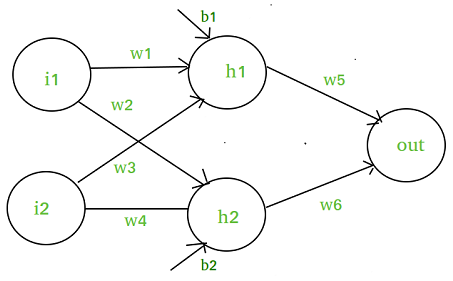
Write down the algebraic equation for y1 in terms of input values i1, i2 and weights w. Briefly explain how neural networks are used for classification.

iv. Give at least three examples how clustering can be used in business analytics. In your answer explain how each business case could be addressed using clustering.

Note - Word can be around 500 excluding references.

Attachment:- Assignment File.rar

Reference no: EM132312523

Questions Cloud

Identify an existing at-risk population : Identify an existing at-risk population. Using aggregated statistics, include identified criteria and data that substantiates why this population is at risk.
What distinctive characteristics of public health necessary : Describe professionalism in the context of public health. What skills, attributes, and behaviors are expected of the public health professional?
Determinants of economic growth : How do the typical determinants of economic growth compare and contrast with these factors?
Result of providing financial advice and selling investment : What is the main problem which arises as a result of providing financial advice and selling investment products in the same organisation?
Explain difference between classification and prediction : MITS6002 Business Analytics Assignment, Victorian Institute of Technology, Australia. Explain difference between classification and prediction
Using the basic circular flow model : Using the basic circular flow model, explain why the value of businesses' output of goods and services equals the income of households.
Monetary policy is an important tool to utilize : The challenge that we are facing is how monetary policy is going to affect the decisions that we have to make. How does the FED affect the decisions
Describe the rationale for selecting the best strategy : Describe the rationale for selecting the best strategy. Provide a summary or conclusion bout this experience or assignment and how you may deal with conflict.
What is public good : What is public good? Explain the argument that the private sector will provide too little of a public good.

Reviews

Write a Review

Applied Statistics Questions & Answers

  Hypothesis testing

What assumptions about the number of pedestrians passing the location in an hour are necessary for your hypothesis test to be valid?

  Calculate the maximum reduction in the standard deviation

Calculate the maximum reduction in the standard deviation

  Calculate the expected value, variance, and standard deviati

Calculate the expected value, variance, and standard deviation of the total income

  Determine the impact of social media use on student learning

Research paper examines determine the impact of social media use on student learning.

  Unemployment survey

Find a statistics study on Unemployment and explain the five-step process of the study.

  Statistical studies

Locate the original poll, summarize the poling procedure (background on how information was gathered), the sample surveyed.

  Evaluate the expected value of the total number of sales

Evaluate the expected value of the total number of sales

  Statistic project

Identify sample, population, sampling frame (if applicable), and response rate (if applicable). Describe sampling technique (if applicable) or experimental design

  Simple data analysis and comparison

Write a report on simple data analysis and comparison.

  Analyze the processed data in statistical survey

Analyze the processed data in Statistical survey.

  What is the probability

Find the probability of given case.

  Frequency distribution

Accepting Manipulation or Manipulating

Free Assignment Quote

Assured A++ Grade

Get guaranteed satisfaction & time on delivery in every assignment order you paid with us! We ensure premium quality solution document along with free turntin report!

All rights reserved! Copyrights ©2019-2020 ExpertsMind IT Educational Pvt Ltd