Estimate the number of persons per household in the us

Assignment Help Basic Statistics
Reference no: EM131724078

Question: Refer to Exercise about the trend in number of persons per household.

a. Using statistical software, determine the least squares line for these data. Use the equation of this line to estimate the number of persons per household in the year 2010 (Data source: perhouse dataset on the website for this book).

b. What is the slope of the line? Interpret the slope in the context of these variables.

c. Based on the regression line, what would be the predicted persons per household in the year 2200? Realistically, what is the lowest possible value of the persons per household number? How does the estimate for 2200 compare to this value?

d. Part (c) illustrates that the observed pattern can't possibly continue in the same manner forever. Sketch the pattern for the trend in persons per household that you think might occur between now and the year 2200.

Exercise: U.S. Census Bureau estimates of the average number of persons per household in the United States for census years between 1850 and 2000 are shown in the following table. (These data are in the file perhouse on the companion website.)

1166_Persons.jpg

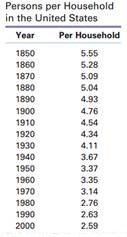
a. Draw a scatterplot for the relationship between persons per household and year. Is the relationship linear or curvilinear? Is the association between persons per household and year positive or negative?

b. On your scatterplot, add a line that you believe fits the data pattern. Extend this line to the year 2010. On the basis of this line, estimate the number of persons per household in the United States in the year 2010.

Reference no: EM131724078

Questions Cloud

What is the bonds price : A bond with a face amount of $15,000 has a current price quote of 108.55. What is the bond's price
Examine pros and cons of a dsl and cable internet connection : Examine the major pros and cons of a DSL and a cable Internet connection. Compare DSL and cable Internet connections based on availability.
Relationship between gender and political party : Suppose a study on the relationship between gender and political party included 200 men and 200 women and found 180 Democrats and 220 Republicans.
Examine the benefits and drawbacks of each format for users : Examine the benefits and drawbacks of each format for users. Determine whether you agree or disagree that Blu-ray was the superior choice technologically.
Estimate the number of persons per household in the us : Using statistical software, determine the least squares line for these data. Use the equation of this line to estimate the number of persons per household.
Briefly define horizontal analysis and vertical analysis : Briefly define horizontal analysis, vertical analysis, and ratio analysis to financial statements
Examine reasons that some users are avoiding windows eight : From the first e-Activity, examine two of the most common reasons that some users are avoiding Windows 8.
Identify the type of research : Identify the type of research (survey, experiment, etc.) used with the study and evaluate the appropriateness of that methodology.
Discuss important e-commerce business models : Describe and provide examples of important e-commerce business models

Reviews

Write a Review

Basic Statistics Questions & Answers

  Discuss the implications of magnitude from 0 to 1 sign or

discuss the implications of magnitude from 0 to 1 sign or - and probability versus causality for the correlation

  Determining percentage of take-out pizzas

Assume that Leo advertises "If it takes more than 30 minutes to get your pizza, you get it free". What percentage of his take-out pizzas will have to give away free?

  Decision using the p-value approach

Make a decision using the p-value approach at the given α = 0.05.

  Problem regarding the professional tennis

Serena Williams made a successful first serve 67% of the time in a Wimbledon finals match against her sister Venus. If she continues to serve at the same rate the next time they play and serves 6 times in the first game, determine the following pr..

  Probability of exactly four defective pieces found in sample

15 pieces are selected at random for inspection. What is the probability of exactly 4 defective pieces being found in the sample?

  If 400 fans who attended a college football game last week

suppose 80 of the college football fans root for the home team. if 400 fans who attended a college football game last

  Population mean price of all mathematics dictionaries

A random sample of 10 mathematics dictionaries had an average price of $17.50 with a sample standard deviation of $3.85. Find the 95% confidence interval for µ, the population mean price of all mathematics dictionaries.

  What does the box plot tell you about given data

For the data given problem, construct a box plot. What does the box plot tell you about these data?- Construct a stem-and-leaf display of these data. What does the display tell you about the data?

  Some examples of descriptive statistics

Critically discuss some examples of descriptive statistics? Why are they used in research? What is a confidence interval?

  Find percent confidence interval for population mean

Each home was 24 and the standard deviation of the sample was 5 people. Develop a 98 percent confidence interval for the population mean.

  Probability that it has a hairline crack

In a shipment of 53 vials, only 13 do not have hairline cracks. If you randomly select one vial from the shipment, what is the probability that it has a hairline crack?

  Identify the rejection region and give conclusion

Construct a 95% confidence interval for the proportion of all those who experience some type of discomfort.

Free Assignment Quote

Assured A++ Grade

Get guaranteed satisfaction & time on delivery in every assignment order you paid with us! We ensure premium quality solution document along with free turntin report!

All rights reserved! Copyrights ©2019-2020 ExpertsMind IT Educational Pvt Ltd