Reference no: EM131017653
I. Binary Choice-
Use the information below to answer the next TWO (2) questions.
The U.S. federal government budget in fiscal year 2013 had 69% of government expenditures devoted to paying for social security, unemployment compensation, Medicare and other healthcare programs, interest on the debt, and Veterans benefits. These expenditures are termed "entitlements" or interest on the debt and cannot be altered without changes in the legislation that provided these programs. Of the remaining 31% of the federal budget, 18% was for military spending and 13% was for "non-military programs".
1. Given the above figures and assuming that the government does not increase or decrease their borrowing or alter existing legislation, what would have been the opportunity cost of increasing spending on "non-military programs" from 13% to 15% of the budget in 2013? The opportunity cost would have equaled:
a) An increase in military spending equal to an additional 2% of the budget.
b) A decrease in military spending equal to a decrease from 18% to 16% of the budget.
2. Based upon this information and assuming that the government does not increase or decrease their borrowing or alter existing legislation, suppose Congress in 2013 had proposed 17% of the budget for the Military and 17% for non-military spending. This proposal would mean:
a) Congress had achieved a feasible, equal balance between the military and non-military spending.
b) Congress had proposed a budget that was not feasible since this proposal lies outside the government's PPF.
3. Joe can produce ten ornaments and zero notepads, or he can produce zero ornaments and five notepads from his available resources, technology and time. Or, Joe can produce any combination of ornaments and notepads that lie on the linear PPF that contains the two production points you were given. Joe's opportunity cost of producing 8 ornaments is:
a) The two additional ornaments he could have produced.
b) The four notepads he could have produced.
Use the following figure to answer the next question.
4. Given the above PPF, suppose that the U.S. economy is going to produce at point A, point B, or point C. Given that economic growth is the only goal for the U.S. economy, how would these choices be ordered if ranking them from the best choice to the worst choice for achieving this stated goal?
a. Point B; point C; point A
b. Point C; point B; point A
5. Suppose Jerry and Carolyn's demand for ice cream cones are given by the following two equations where P is the price per cone and Q is the quantity of ice cream cones:
Jerry's Demand for ice cream: Q = 20 - 2P
Carolyn's Demand for ice cream: Q = 40 - 4P
Suppose that Jerry and Carolyn are the only demanders of ice cream in this market. If the price of ice cream is $5 per ice cream cone, then the quantity demanded in this market will be:
a. 30 ice cream cones.
b. 16.25 ice cream cones.
6. If we see a supply and demand graph and the price and quantity are not at the equilibrium point, this means that
a) The quantity of the good being offered by suppliers at the current price is not equal to the quantity of the good that buyers are willing to purchase at that price.
b) The price is too high for the buyers to be willing to buy what the suppliers are offering.
7. If the equilibrium price for a good in a market is $6, and the government sets a price ceiling for the good, then:
a) This will definitely cause a shortage of the good.
b) This will cause a shortage of the good if the ceiling is set below the equilibrium price.
8. Consumer surplus is:
a) The amount consumers would have been willing to pay for the good above and beyond what they actually did pay.
b) A condition of excess supply when the market is out of equilibrium.
9. Consider the two markets for goods A and B represented in the following graphs.
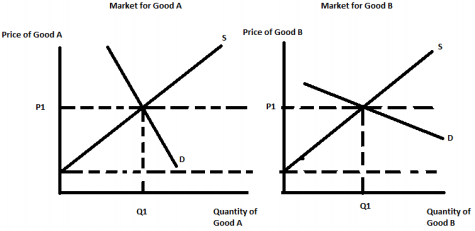
In each market the initial equilibrium price and quantity happen to be exactly the same (Q1, P1). Suppose that the government is discussing the implementation of an excise tax of $x amount in both markets (the amount of the excise tax will be the same in both markets). Given this information and the above graphs, the deadweight loss from this excise tax will be smaller in the market for:
a. Good A.
b. Good B.
10. Under an effective price guarantee program:
a) Consumers pay a higher price compared to the no-intervention market outcome and the government purchases the surplus quantity of the good that is produced with the price guarantee program.
b) Consumers pay a lower price compared to the no-intervention market outcome and the government does not purchase any of the good produced with the price guarantee program.
II. Multiple Choice-
Use the following information to answer the next two (2) questions:
Consider the market for snow shovels in Madison. Prior to the arrival of winter analysts of this market predict that the price of a snow shovel will be $24 and the number of snow shovels sold will be 50 shovels. However the winter proves to much more severe than usual and the actual price of snow shovels rises to $28 and 100 shovels are sold.
11. In the context of the supply and demand diagram, the increase in the price of the shovels from $24 to $28 was the result of:
a) A shift in the demand curve and a movement along the supply curve.
b) A movement along the demand curve.
c) A shift in the supply curve.
d) A shift in the supply curve and a movement along the demand curve.
12. Suppose that in the market for snow shovels in Madison there is an unexpectedly harsh winter, but simultaneously there is also a technological breakthrough in the manufacture of snow shovels that lowers the cost of producing snow shovels. Given this technological advance and the winter being more severe than expected, then relative to the initial equilibrium price of $24 and initial equilibrium quantity of 50 shovels, we can expect the new equilibrium quantity of snow shovels sold:
a) to decrease, but the equilibrium price of snow shovels may increase or decrease.
b) to increase, but the equilibrium price of snow shovels may increase, decrease, or remain the same.
c) may increase, decrease, or remain the same, but the equilibrium price of snow shovels will increase.
d) may increase, decrease, or remain the same, but the equilibrium price of snow shovels will decrease.
13. Suppose a sharp decrease in the price of oil lowers the price of gasoline substantially. Holding everything else constant, we would expect the effect in the market for gasoline-powered cars of this decrease in the price of gasoline to shift the demand for cars to the:
a) left and cause the price of gasoline-powered cars to decrease.
b) left and cause the price of gasoline-powered cars to increase.
c) right and cause the price of gasoline-powered cars to increase.
d) right and cause the price of gasoline-powered cars to decrease.
14. Consider the market for paper. The government wishes to discourage paper consumption so the government passes a price floor setting the price of paper at $15 per ream instead of its market equilibrium price of $8 per ream. (A ream is 500 sheets of paper.) Given this price floor and holding everything else constant, we know that the price floor will result in a:
a. surplus of the good and a reduction in producer surplus.
b. shortage of the good and a reduction in producer surplus.
c. surplus of the good and a reduction in consumer surplus.
d. shortage of the good and a reduction in consumer surplus.
15. Suppose that Ace Tires and Mickey's Rollers are the only two producers of tires in the economy. The supply curves for each of these firms is given by the following equations where P is the price per tire and Q is the quantity of tires.
Supply curve for Ace Tires: P = 20 + (1/5)Q
Supply curve for Mickey's Rollers: P = 40 + (9/50)Q
Given this information, which of the following graphs accurately represents the market supply curve?

a. Graph A
b. Graph B
c. Graph C
d. Graph D
Use the figure below for the next four (4) questions. Assume that all the demand curves as well as the supply curve are linear in this market.
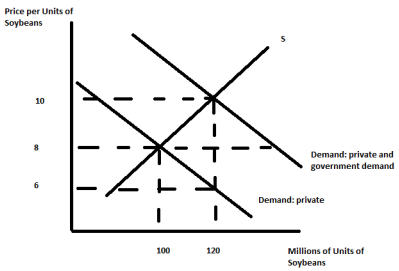
16. Consider the Soybean market as illustrated in the above figure. Suppose the government wanted to create a price support program for soybean farmers that would raise the market price to $10 a unit of soybeans from the current equilibrium price of $8 per unit of soybeans. To do this the government would enter the market and buy soybeans, adding to the demand so that the price would rise to $10 per unit of soybeans. As a result the government would have to buy:
a) 120 million units of soybeans, and total farmer revenue would be $1200 million.
b) 20 million units of soybeans, and total farmer revenue would increase by $200 million.
c) 220 million units of soybeans, and total farmer revenue would be $2200 million.
d) 40 million units of soybeans, and total farmer revenue would increase by $400 million.
17. Given the above figure and the government price support program described in the last problem, the expenditure by the government on soybeans given this program equals _____. Assume that there are no storage costs to the program.
a) $120 million
b) $400 million
c) $20 million
d) $200 million
18. Suppose that the government decides to implement a price guarantee program in the market for soybeans. With the price guarantee program the government promises soybean farmers that they will get $10 per unit of soybeans. Suppose the government also limits farmers to growing 100 units of soybeans but promises that they will get paid $10 per unit of soybeans they grow. The farmers produce the 100 units of soybeans and are told to sell them to the private demanders of soybeans and then the government will pay each farmer the difference between the price they get from private demanders and the guaranteed price of $10 per unit of soybeans. Given this program, what price will the private demanders pay per unit of soybeans that they buy?
a) $8
b) $10
c) $9, since this is the average of the two prices ($8 per unit and $10 per unit)
d) The demand curve labeled "D : private" and the knowledge that the quantity supplied in the market will be 100 million bushels is insufficient to determine the market price paid by the private demanders of the good.
19. Given the above figure and the price guarantee program described in the last question, how much will it cost the government to carry out this "price guarantee" program?
a) $100 million
b) $40 million
c) $2 million
d) $200 million
Use the figure below to answer the next question. Treat this figure as drawn to scale. This is a bit of a "thought experiment"! So, as a hint: think about this one a bit.
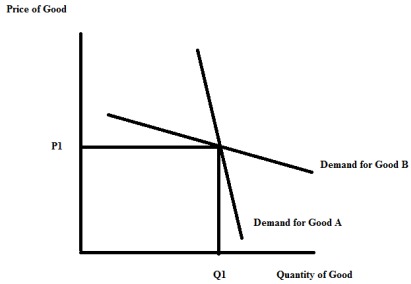
20. Consider the two demand curves in the above figure. As shown, one of them is the demand curve for Good A and one is the demand curve for Good B. Currently the price of Good A and the price of Good B is P1. Suppose the sellers of these two goods wanted to increase the revenue (remember that revenue is the same as expenditure: it is simply the price times the quantity) from the sale of these two goods. Then, given the above figure, the sellers should:
a) decrease the price of both goods.
b) increase the price of both goods.
c) decrease the price for Good A and increase the price for Good B.
d) increase the price for Good A and decrease the price for Good B.
Use the figure below to answer the next question.
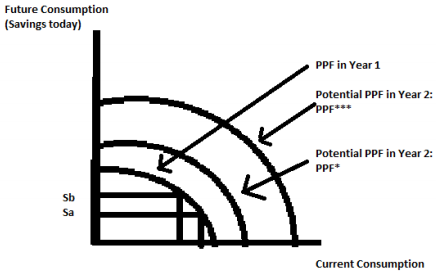
21. In the above figure, PPF in Year 1 shows the PPF for an economy in a given year. During this year the people in this economy can make a choice of saving the amount Sa to invest to raise future consumption or they can instead choose a higher amount of savings in year 1 shown as Sb. The PPF for year 2 could be at PPF* or at PPF*** as shown in the diagram depending on whether people save Sa or Sb in Year 1.
Given this information, if people in the economy choose the amount of savings shown as _____in Year 1, then the PPF in year 2 will be _____.
a) Sa, PPF*
b) Sb, PPF*
a) Sa, PPF***
d) It is not possible to reach PPF*** with either choice!
Use the figure below to answer the next question. The figure depicts the market for movie pass packages at a local movie theater located close to campus. Each movie pass package is good for any six movies during a semester. The price is in dollars per package.
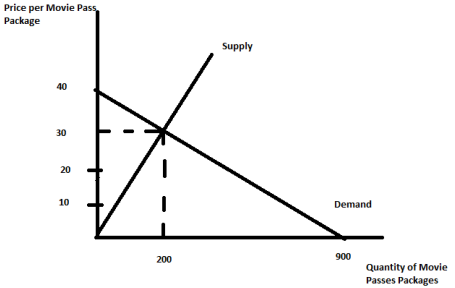
22. Based on the information in the above figure, the consumer surplus in this market is ____________, the producer surplus is ________, and this movie pass package appears to offer a better gain from trade for the _________ than for the ______________.
a) $1,000; $6,000; theater; customers
b) $2,000; $6,000; customers; theater
c) $1,000; $3,000; customers; theater
d) $1,000; $3,000; theater; customers
Use the figure below and the following information to answer the next three (3) questions.
You are told that Joe can produce ten ornaments and zero notepads or he can produce zero ornaments and five notepads from his available resources, technology or time. Or, Joe can produce any combination of ornaments and notepads that lie on the linear PPF that contains the two production points you were given.
Both Joe and Wei produce notepads and ornaments and you are provided with the following joint PPF for Joe and Wei.
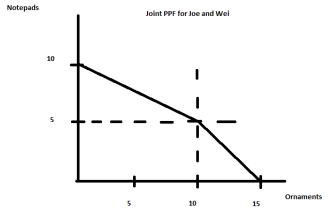
23. Given the above information and graph: which of the following graphs represents Wei's PPF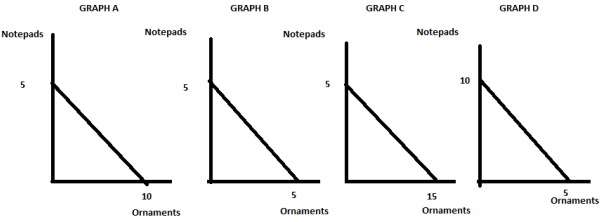
a) Graph A
b) Graph B
c) Graph C
d) Graph D
24. Given the above information and graph: which of the following statements is true?
a. Wei has the comparative advantage in the production of notepads and Wei has the absolute advantage in the production of ornaments.
b. Joe has the comparative advantage in the production of notepads and Wei has the absolute advantage in the production of ornaments.
c. Joe has the comparative advantage in the production of ornaments and Wei has the absolute advantage in the production of ornaments.
d. Wei has the comparative advantage in the production of notepads and Joe has the absolute advantage in the production of ornaments.
25. Joe and Wei decide to specialize according to their comparative advantage and then trade with one another. Which of the following combinations of is inefficient given this decision?
a) Joe produces 8 ornaments and 1 notepad while Wei produces 5 notepads
b) Joe produces 6 ornaments and 1.5 notepads while Wei produces 5 notepads
c) Joe produces 10 ornaments while Wei produces 4 notepads and 2 ornaments
d) Joe produces 8 ornaments and 2 notepads while Wei produces 3 notepads and 2 ornaments
Use the following information to answer the next three (3) questions.
Suppose there exists a market for trips to the moon. Demand comes from wealthy consumers and poor consumers, who have demand curves given by the following equations where P is the price per trip and Q is the quantity of trips:
Wealthy: QWealthy = 1000 - P
Poor: P = 500 - (1/2)QPoor
Supply is made up of two firms, Virgo Interstellar and SpaceY, which have supply curves given by:
Virgo: QVirgo = 2P - 1800
SpaceY: P = (1/2)QSpaceY + 900
26. What is the equation for the market supply curve for all producers in this market?
a) P = Q + 900 if Q > 0
b) Q = 4P - 1800 if P > 500
c) P = (5/2)Q - 900 if Q > 0
d) P = (1/4)Q + 900 if Q > 0
27. What is the equation for the market demand curve for all consumers in this market?
a) P = 1000 - Q if 0 < Q < 500, P = (2000/3) - (1/4)Q if 500 < Q < 1500
b) Q = 3000 - 3P if 0 < P < 1000
c) P = 1000 - Q if 0 < Q < 500, P = (2000/3) - (1/3)Q if 500 < Q < 1500
d) Q = 1000 - P if 500 < P < 1000, Q = 1000 - 2P if 0 < P < 500
28. In the market equilibrium the price is ____, wealthy consumers buy _____ trips to the moon and poor consumers buy _____ trips to the moon.
a) $900; 100; 0
b) $800; 100; 100
c) $800; 200; -600
d) $920; 80; 0
29. Demand and supply for widgets are given by the following equations where P is the price per widget in dollars and Q is the quantity of widgets:
Demand for widgets: P = 100 - Q
Supply of widgets: P = Q
How much deadweight loss would be caused by the government imposing a price floor of $60 in this market?
a) $0
b) $100
c) $200
d) $400
Use the two figures below to answer the next question.
30. Figure A shows "Employment" measured in millions of workers from 2001 to 2015 in the United States. "Employment" is the number of people with jobs. As you can see from inspecting this graph, the number of people with jobs grew from 138 million in 2010 to 148 million, an increase of 10 million people, since 2010. This numeric value provides one measure of how the economy is doing and this is the data usually cited in the news and by the Obama administration.
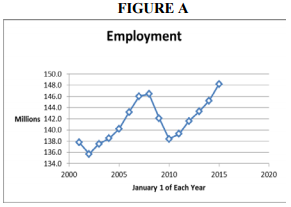
However, these data do not take into account that the population has grown. Since 2010 the population of people over 16 in the United States increased by 13 million people. FIGURE B provides the ratio of "Employment to the Population", expressed as a percentage-this is the number of people with jobs as a percent of the population of those over age 16.
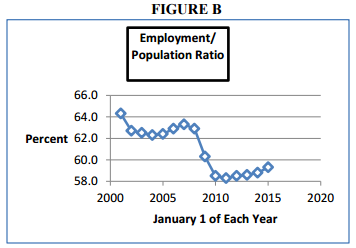
Based on the information presented in these two graphs, which of the following statements is correct? [Note: make sure you read through all the responses since they are somewhat "nuanced".]
a) Job (employment) growth from about 2010 to 2015 shows a complete recovery from its low point if the population in the United States had stayed constant.
b) Jobs (employment) relative to the population have grown between 2010 and 2015 so that the economy has recovered about half way from its low point even allowing for population growth.
c) Jobs (employment) relative to the population have grown between 2010 and 2015 so that the economy has recovered some but well under half of the way back from its low point.
d) Answers (a) and Answer (c) are both correct answers.
III. PROBLEMS-
1. Use the following graph depicting the market for widgets for this set of questions. Assume that all demand and supply curves are linear.
a) Given the above graph, the initial equilibrium price is _____ and the initial equilibrium quantity is _____.
b) Given the above graph, calculate the value of consumer surplus initially and the value of producer surplus initially. Show your work.
Consumer Surplus = CS =
Producer Surplus = PS =
Now suppose there is a technological improvement in the production of widgets that shifts the supply curve from the initial supply curve to the new supply curve. Assume the new supply curve is parallel to the initial one.
c) Given the above graph, the new equilibrium price is _____ and the new equilibrium quantity is _____. (Provide numeric values and show your work.)
d) Given the above graph, what is the numeric value of consumer surplus after the technological breakthrough? What is the numeric value of producer surplus after the technological breakthrough? Show your work.
Consumer Surplus' = CS' =
Producer Surplus' = PS' =
e) What is the change in CS given this technological breakthrough (note whether it is a positive or negative change)? _________________What is the change in PS given this technological breakthrough (note whether it is a positive or negative change)?________________________
2. You are given the following information about Juan and Carlos who both produce notepads and ornaments.
|
Juan |
Carlos |
| Notepads |
2 hours of labor needed to produce one notepad |
1 hour of labor needed to produce one notepad |
| Ornaments |
4 hours of labor needed to produce one ornament |
3 hours of labor to produce one ornament |
a. Suppose that Juan and Carlos only use time to produce notepads and ornaments and that they both have 24 hours of labor available to devote to the production of these two goods. In the space below draw two separate graphs depicting their PPFs. Make sure your graphs are completely and carefully labeled. In your graphs measure notepads on the vertical axis and ornaments on the horizontal axis.
b) Write an equation in slope-intercept form for Juan's PPF using N as the symbol for notepads and Q as the symbol for ornaments.
c) Write an equation in slope-intercept form for Carlos' PPF using N as the symbol for notepads and Q as the symbol for ornaments.
d) In the space below draw the joint PPF for Juan and Carlos. Label all intercepts, as well as "kink" points in your graph. Make sure your graph is clearly and completely labeled.
e) Write an equation or equations for the joint PPF in slope-intercept form measuring notepads (N) on the vertical axis and ornaments (Q) on the horizontal axis. For any equation you provide, make sure you include a range or domain if relevant.
f) If Carlos makes 18 notepads and Juan and Carlos are producing on their joint PPF, what is the maximum number of ornaments that Juan and Carlos can make? Explain your answer verbally.