Reference no: EM131654807
Workshop Assignment: Markets, Demand and Supply
1. The following passage refers to the operation of a free-market economy. Cross-out the words (in italics) which are incorrect.
In a totally free-market economy, the quantities of each type of good that are bought and sold, and the amounts of factors of production (labor, land and capital) that are used, are determined by the decisions of individual households and firms through the interaction of demand and supply.
In goods markets, households are suppliers / demanders and firms are suppliers / demanders. In labour markets, households are suppliers / demanders and firms are suppliers / demanders.
Demand and supply are brought into balance by the effects of changes in price. If supply exceeds demand in any market (a surplus), the price will rise / fall / stay the same. This will lead to a rise in the quantity both demanded and supplied / a fall in the quantity both demanded and supplied / a rise in the quantity demanded but a fall in the quantity supplied / a rise in the quantity supplied but a fall in the quantity demanded. If, however, demand exceeds supply in any market (a shortage), the price will fall / rise / stay the same. This will lead to a fall / rise in the quantity demanded and a fall / rise in the quantity supplied. In either case the adjustment of price will ensure that demand and supply are brought into equilibrium, with any shortage or surplus being eliminated.
2. How will the market demand curve for a 'normal' good shift (i.e. left, right or no shift) in each of the following cases?
(a) The price of a substitute good falls ................................................................. left / right / no shift
(b) Population rises ................................................................................................ left / right / no shift
(c) Tastes shift away from the good...................................................................... left / right / no shift
(d) The price of a complementary good falls........................................................ left / right / no shift
(e) The good becomes more expensive ................................................................ left / right / no shift
3. How will the market supply curve of a good shift (i.e. left, right or no shift) in each of the following cases?
(a) Costs of producing the good fall. .................................................................... left / right / no shift
(b) Alternative products (in supply) become more profitable.............................. left / right / no shift
(c) The price of the good rises............................................................................... left / right / no shift
(d) Firms anticipate that the price of the good is about to fall. ............................ left / right / no shift
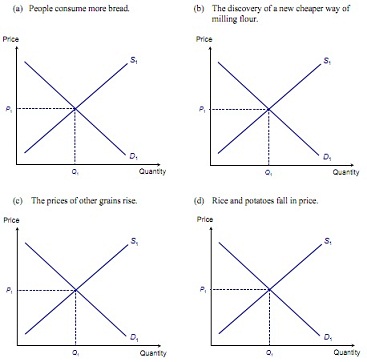
4. How will the following changes affect the market price of wheat flour (assuming that the market is initially in equilibrium)? In each case, sketch what happens to the demand and/or supply curves and, as result, what happens to the equilibrium price.

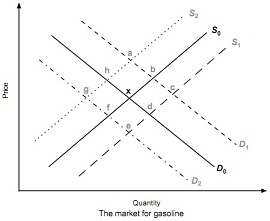
5. The diagram below shows the demand for and supply of gasoline. The market is initially in equilibrium at point x.
There is then a shift in the demand and/or supply curves, with a resulting change in equilibrium price and quantity.
To which equilibrium point (a, b, c, d, e, f, g or h) will the market move from point x after each of the following changes?

(a) A rise in the cost of refining gasoline...........................................................................................
(b) A fall in bus and train fares...........................................................................................................
(c) A fall in the price of crude oil and an increase in the price of cars. ............................................ (d) A rise in tax on gasoline and a reduction in tax on cars. .............................................................
6. The demand and supply schedules for wheat in a free market are as follows:
|
Price per ton ($)
|
120
|
160
|
200
|
240
|
280
|
320
|
360
|
400
|
|
Tons demanded per week
|
725
|
700
|
675
|
650
|
600
|
550
|
500
|
425
|
|
Tons supplied per week
|
225
|
300
|
400
|
500
|
600
|
750
|
1000
|
1300
|
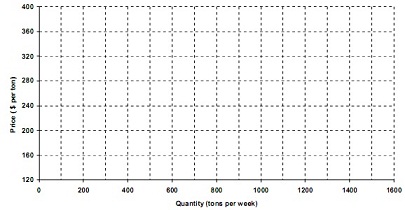
(a) Draw the demand and supply curves on the following diagram:

(a) What is the equilibrium price?......................................................................................................
(b) Suppose the government fixes a maximum price of $200 per tonne. What will be the effect?
(c) Suppose that supply now increases by 150 tons at all prices. Enter the new figures.
|
Price per ton ($)
|
120
|
160
|
200
|
240
|
280
|
320
|
360
|
400
|
|
Tons demanded per week
|
725
|
700
|
675
|
650
|
600
|
550
|
500
|
425
|
|
(old) Tons supplied per week (new) Tons supplied per week
|
225
|
300
|
400
|
500
|
600
|
750
|
1000
|
1300
|
(d) How much will price change from the original equilibrium (assuming that the government no longer fixes a maximum price)? How much more will be sold?
Change in price ............................................................................................................................
Change in quantity........................................................................................................................