Draw a scatter diagram for given data

Assignment Help Applied Statistics
Reference no: EM132152225

Question 1 - Answer all parts of this question.

a) A cost accountant has derived the following data on the weekly output of standard size boxes from a factory.

154_table.png

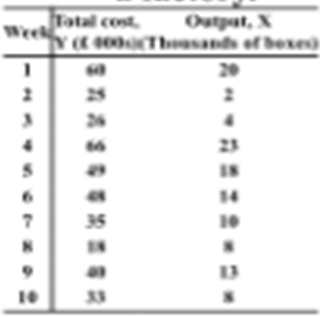
i) Calculate the regression coefficients β^1 and β^2 for the equation Y^i - β^1+ β^2Xi before estimating the regression model, plot the data.

ii) Intercept the regression coefficients β^1 and β^2.

b) Repeat this question by using log of each of the above variables.

Question 2 - Answer all parts of this question

The following data were given to support the theory that high protein diets reduce the fertility of people:

484_table1.png

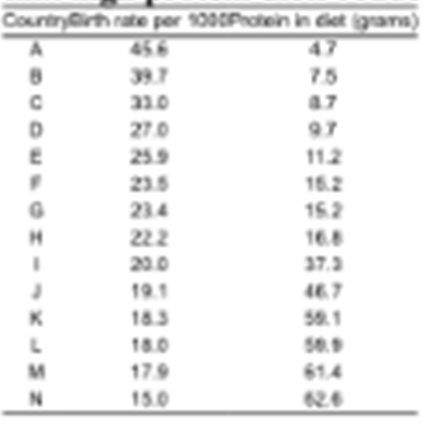
a) Estimate the least square regression line Y = β1 + β2X for the data above.

b) Calculate the coefficient of correlation.

c) Are data o these type adequate to establish a 'cause and effect' relationship between these two variables? Can any conclusions be drawn from the result of your calculations?

Question 3 - Answer all parts of this question

To investigate the relationship between the level of advertising in local papers and the level of sales of a particular consumer product, the marketing manager of a national firm used different levels of advertising in 10 randomly selected geographic areas. The results are given in the table below:

1238_table2.png

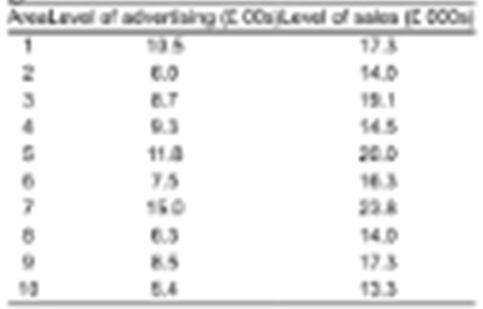
a) Draw a scatter diagram for these data.

b) Estimate the least squares regression line Y = β1 + β2X for the data above.

c) Calculate the R2 and interpret the result.

d) Use your OLS estimates to predict the level of sales in an area in which £1000 is spent on advertising.

Reference no: EM132152225

Questions Cloud

Show how you derive a recurrence system for the shellfish : Show how you derive a recurrence system for the shellfish population in the n-th year after 2000.
Write a procedure that receives a binary file time value : Write a procedure that receives a binary file time value in the AX register.
What is the steady-state fraction of residents : Researchers have collected data on the number of undergraduate students either involved in a relationship or uninvolved. Among involved students.
What tools do you use in your work environment : How was that function performed before the introduction of the tool? How has the tool effected your work efficiency and effectiveness.
Draw a scatter diagram for given data : Draw a scatter diagram for these data. Use your OLS estimates to predict the level of sales in an area in which £1000 is spent on advertising
How you would punish the wrongdoers : Research Wells Fargo's recent unethical business practices. Summarize what happened, who was involved and who was affected. Then give a recommendation.
What is the time for main memory to transfer a block : What is the time for main memory to transfer a block of size 64 to main memory.
How guaranty contracts are used in business : Determine under what circumstances a contract should be allowed to be rescinded because of a unilateral mistake. Provide one example of a situation.
Create a web page of international information for workers : Create a Web page of international information for workers and managers who are planning assignments in Germany.

Reviews

Write a Review

Applied Statistics Questions & Answers

  Hypothesis testing

What assumptions about the number of pedestrians passing the location in an hour are necessary for your hypothesis test to be valid?

  Calculate the maximum reduction in the standard deviation

Calculate the maximum reduction in the standard deviation

  Calculate the expected value, variance, and standard deviati

Calculate the expected value, variance, and standard deviation of the total income

  Determine the impact of social media use on student learning

Research paper examines determine the impact of social media use on student learning.

  Unemployment survey

Find a statistics study on Unemployment and explain the five-step process of the study.

  Statistical studies

Locate the original poll, summarize the poling procedure (background on how information was gathered), the sample surveyed.

  Evaluate the expected value of the total number of sales

Evaluate the expected value of the total number of sales

  Statistic project

Identify sample, population, sampling frame (if applicable), and response rate (if applicable). Describe sampling technique (if applicable) or experimental design

  Simple data analysis and comparison

Write a report on simple data analysis and comparison.

  Analyze the processed data in statistical survey

Analyze the processed data in Statistical survey.

  What is the probability

Find the probability of given case.

  Frequency distribution

Accepting Manipulation or Manipulating

Free Assignment Quote

Assured A++ Grade

Get guaranteed satisfaction & time on delivery in every assignment order you paid with us! We ensure premium quality solution document along with free turntin report!

All rights reserved! Copyrights ©2019-2020 ExpertsMind IT Educational Pvt Ltd