Do either of the processes fit a normal distribution

Assignment Help Applied Statistics
Reference no: EM132329595

Statistics for Managerial Decision Making Assignment -

Operations and production managers often use the normal distribution as a probability model to forecast demand in order to determine inventory levels, manage the supply chain, control production and service processes, and perform quality assurance checks on products and services. The information gained from such statistical analyses help managers optimize resource allocation and reduce process time, which in turn often improves profit margins and customer satisfaction.

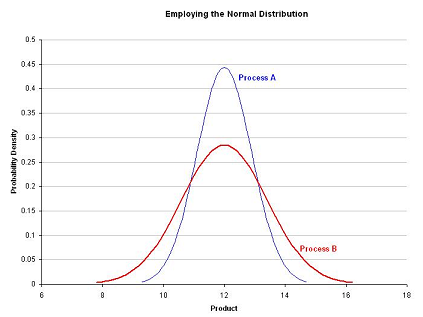
Based on your understanding of the characteristics of the normal distribution, examine the chart below. Process A standard deviation is .9, Process B standard deviation is 1.4, and the mean of both processes is 12.

1293_figue.png

Contribute to our discussion by posting a response to ONE of the questions below.

1. Do either of the processes fit a normal distribution? Why or why not?

2. Which of the processes shows more variation? What does this mean practically?

3. If the product specification quality limits were 12 +/- 3, which of the processes more consistently meets specification? Explain why.

4. If the product specification quality limits were changed to 12 +/- 6, is quality loosening or tightening? Which process would benefit the most from this change?

5. Are there processes at your place of employ that you believe follow a normal distribution? If so, describe one. Why do you believe it is normal?

Verified Expert

This paper about statistical control process. It discusses the use of normal distribution and t distribution in setting control limits of a production process.A comparison is made between T distribution and normal distribution and how they change as the number of degrees of freedom/sample size increase. Consistence of a process is also discussed in terms of sample variability.The paper is instrumental that readers seeking to understand the relationship between a normal curve and a T distribution curve

Reference no: EM132329595

Questions Cloud

Conduct of the management planning workshop : Consider specific activities and milestones that need to be accomplished in a three-day senior leadership planning retreat. Additionally, suggestions
Different types of human resource values and strategies : You should have a firm grasp on the different types of human resource values and strategies that are commonplace in the workforce.
What are the characteristics of a strong body paragraphs : What are the characteristics of a strong body paragraphs, and how do the details in the body paragraph relate to the topic sentence
Oldest formal school of management thought : The Classical School is the oldest formal school of management thought. The classical school of thought generally concerns ways to manage work
Do either of the processes fit a normal distribution : MGMT650 Statistics for Managerial Decision Making Assignment, University of Maryland University College, USA. Do either of processes fit a normal distribution
How does darwin''s theory relate to employment : How does Darwin's theory relate to Employment, for job seekers as well as employers?
Was the recognition one that you appreciated or did if fall : The Surprising Truth About What Motivates Us. Have you ever worked at a company where you have received recognition for your contributions?
Describe the two main types of inferential statistics : Manukau Institute of Technology-341.629 Research Methodology-New Zealand-Identify and research a New Zealand company or organisation that you would like to do.
Entertainment law firm of dewey cheetum : You are working as a summer intern at the entertainment law firm of Dewey Cheetum & Howe. Your firm represents an exciting new musical talent

Reviews

inf2329595

7/8/2019 5:54:23 AM

The solution comprises of lots of calculations of the statistics and it really difficult for me to complete it on time. Thanks to expertsmind for providing me the exact and quality solution...

Write a Review

Applied Statistics Questions & Answers

  Construct a frequency distribution

PSY-520 Exercises - Construct a frequency distribution for the number of difference residences occupied by graduating seniors during their college career

  The correlation coefficient between variable x1

Which of the following statements about the correlation coefficient between variable X1 (Number of advertisements placed the previous week) and variable X2 (Number of calls received the previous week) is correct:

  Find the exponential function of best fit

Find the exponential function of best fit and graph it on the scatterplot. State the formula for the exponential function. It should have the form y = A e- bx where software has provided you with the numerical values for A and b.

  Descriptive statistics

Descriptive statistics (5-number summary, mean, mode, range and standard deviation) for each of the four variables along with an explanation of what the descriptive statistics tell us about the motion picture industry.

  Creating a frequency distribution

Individual data values or grouped data when creating a frequency distribution?

  What is proportion of children that receive free vaccination

HSH746/HSH946 Biostatistics Assignment Questions, Deakin University, Victoria, Australia. What is the proportion of children that received the free vaccination

  Present histograms for age and haemoglobin

POPH90144 Linear and Logistic Regression Assignment. Present histograms for age and haemoglobin and describe the distribution of these variables in terms of approximate normality and appropriate measures of centrality and spread

  The file hotelprices contains the prices in english pounds

The file HotelPrices contains the prices in English pounds

  The probability that the sample will contain defects

Two percent (.02) of the items produced by a machine are defective. A random sample of 55 items is selected and checked for defects. Use the normal approximation to the binomial to find: The probability that the sample will contain 4 or more defects?

  Director of quality control for harley davidson

Peter hopper, director of quality control for harley davidson

  Find z value for each of the given observed values of x

Let x be a normally distributed random variable having mean m = 30 and standard deviation s = 5. Find the z value for each of the following observed values of x:

  Describe which method you used to make your determination

Descriptive statistics (correlation coefficient) showing the relationship between median household income (in dollars), and each of the other three variables.

Free Assignment Quote

Assured A++ Grade

Get guaranteed satisfaction & time on delivery in every assignment order you paid with us! We ensure premium quality solution document along with free turntin report!

All rights reserved! Copyrights ©2019-2020 ExpertsMind IT Educational Pvt Ltd