Distribution of salaries

Assignment Help Basic Statistics
Reference no: EM13839980

1. Here are the summary statistics for the weekly payroll of a small company: Lowest salary = 250, mean salary = 500, median salary = 500, range = 1050, IQR = 300, Q1 = 350, standard deviation = 200.

a. In the absence of outliers, do you think the distribution of salaries is symmetric, skewed to the left, or skewed to the right?

b. Suppose the company gives everyone a $50 raise. Tell the new values of each of the summary statistics. New median salary =

New IQR =

c. Instead of a $50 raise, suppose the company gives everyone a 5% raise. Tell the new values of each of the summary statistics below.

New median salary =

New IQR =

2. The following is a list of test scores for the first test of a small stats class. Hint: use your calculator

76        78        60        81

92

79

98        66        50        57

101

88

a. Find the median.

b. Find the IQR

c. Find the mean

d. Find the standard deviation

3. The histogram below shows the distribution of the number of hotdogs eaten for contestants at a hot dog eating contest. The 5-number summary is to the right.
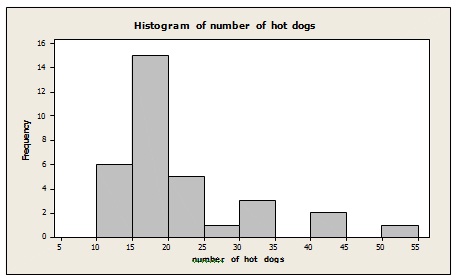
2212_Histogram number of hotdogs.jpg

Max    51

Q3      26

Med   23

Q1     18

Min   11

a. Which summary statistic should you choose to summarize the center in these data?

b. Which summary statistic should you choose to summarize the spread in these data?

c. How many contestants should you classify as outliers?

d. Write a brief description of this distribution (shape, center, spread).

4. Suppose the lengths of green beans for a particular farm are Normally distributed with a mean of 10 inches and a standard deviation of 1.5 inches.

a. What is the z-score for a green bean that measures 12.3 inches?

b. What percent of green beans measure between 6.79 inches and 11.8 inches?

c. What percent of green beans measure more than 7.3 inches?

d. What length represents the 75th percentile?

e. The z-score for a particular green bean from this farm is z = 1.34. What does this tell us about the length of this green been?

5. Listed below are the Fat content (in grams) and Calories for several burgers at Biggies' Burgers Fast Food Restaurant.

Fat (g)

20

23

31

33

37

38

40

43

Calories

410

490

570

590

580

630

670

680

a. Make a scatterplot of these data in your calculator using Fat as the explanatory (X) variable and Calories as the response (Y) variable. Describe each of the following in one word:

Direction:                            

Form:                                 

Strength:                             

b. Find the correlation between Fat and Calories.

c. Find the equation of the regression line to predict Calories from Fat.

d. Use your equation to predict the number of calories for a burger with 25 grams of fat.

6. The ages (in years) and salaries (in thousands of dollars) of a random sample of engineers at a company were recorded. The data will be used to predict an engineer's salary from his/her age. A scatterplot of the data appeared linear in form and the least squares regression line calculated from the data is yˆ    = 1.328x + 21.5 .

a. In terms of age and salary interpret the value of the slope of this line. (be sure to use units in your answer)

b. Predict the salary for an engineer that is 30 years old.

7. The scatterplot below shows the total number of absences and final grades for the students in an Intro Stats course. A Regression to predict grade (in percentage points) from total number of absences (in days) has r = - 0.7878.

2177_Scatterplot of grade.jpg

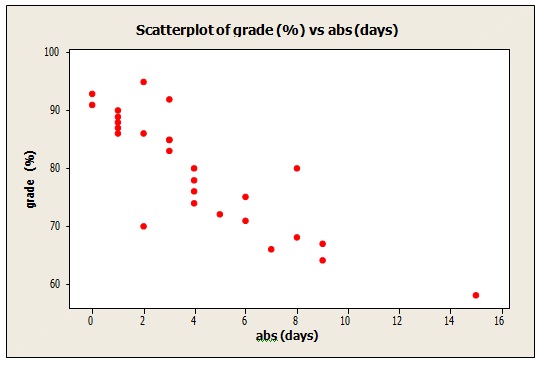
a. Interpret the value of R2 in this context.

b. The total number of absences averaged 3.15 days, with a standard deviation of 3.02 and the grades averaged 84.48% with a standard deviation of 9.93. Write the equation of the regression line.

(Use 4 decimal places for r and 2 decimal places for all other values in your calculation - otherwise your answer may differ from mine).

c. Interpret the slope of this line.

d. Interpret the vertical intercept of this line.

e. In terms of total number of absences and final grades, what can we say about a student that has a positive residual.

Reference no: EM13839980

Questions Cloud

Explain similarity between results for the two organisations : Outline and discuss the main similarities between the results for the two organisations on the nine dimensions. Outline and discuss the main differences between the results for the two organisations on the nine dimensions.
Economic argument for free trade is based on the principle : When a U.S. corporation sends a dividend check to a stockholder residing in Ireland, the transaction is recorded as a, All of the following would be recorded in the current account except
How many units must montson produce to make direct materials : Montson, Inc. produces a product requiring three square feet at $6 per square foot. If the desired ending inventory is $18,000 and the beginning inventory is $36,000, how many units must Montson produce to make direct materials purchases $54,000?
The theory underlying the pv formula : According to the theory underlying the PV formula, would you prefer to receive a)$75 one year from now, b) $85 two years from now or c) $90 three years from now.  relevant market interest rate is 10% and will remain at that rate for the next 3 years...
Distribution of salaries : In the absence of outliers, do you think the distribution of salaries is symmetric, skewed to the left, or skewed to the right?
The death rate among patients in teaching hospitals : A friend tells you that you should never be a patient in a teaching hospital because the death rate among patients in teaching hospitals is higher than in other hospitals. (b) Write down a regression equation where the dependent variable is the death..
Write queries to find out the unused structures : Write queries to find out the unused structures e.g. there is one Superannuation client but no Partnership clients on the starter database.
Which one of the following appears to be least important : Your client says, “With the unrealized gains in my portfolio, I have almost saved enough money for my daughter to go to college in eight years, but educational costs keep going up.” Based on this statement alone, which one of the following appears to..
Compute amount of underapplied or overapplied overhead cost : Compute the amount of under applied or over applied overhead cost for the year - Prepare a schedule of cost of goods manufactured for the year.

Reviews

Write a Review

Basic Statistics Questions & Answers

  Statistics-probability assignment

MATH1550H: Assignment:  Question:  A word is selected at random from the following poem of Persian poet and mathematician Omar Khayyam (1048-1131), translated by English poet Edward Fitzgerald (1808-1883). Find the expected value of the length of th..

  What is the least number

MATH1550H: Assignment:  Question:     what is the least number of applicants that should be interviewed so as to have at least 50% chance of finding one such secretary?

  Determine the value of k

MATH1550H: Assignment:  Question:     Experience shows that X, the number of customers entering a post office during any period of time t, is a random variable the probability mass function of which is of the form

  What is the probability

MATH1550H: Assignment:Questions: (Genetics) What is the probability that at most two of the offspring are aa?

  Binomial distributions

MATH1550H: Assignment:  Questions:  Let’s assume the department of Mathematics of Trent University has 11 faculty members. For i = 0; 1; 2; 3; find pi, the probability that i of them were born on Canada Day using the binomial distributions.

  Caselet on mcdonald’s vs. burger king - waiting time

Caselet on McDonald’s vs. Burger King - Waiting time

  Generate descriptive statistics

Generate descriptive statistics. Create a stem-and-leaf plot of the data and box plot of the data.

  Sampling variability and standard error

Problems on Sampling Variability and Standard Error and Confidence Intervals

  Estimate the population mean

Estimate the population mean

  Conduct a marketing experiment

Conduct a marketing experiment in which students are to taste one of two different brands of soft drink

  Find out the probability

Find out the probability

  Linear programming models

LINEAR PROGRAMMING MODELS

Free Assignment Quote

Assured A++ Grade

Get guaranteed satisfaction & time on delivery in every assignment order you paid with us! We ensure premium quality solution document along with free turntin report!

All rights reserved! Copyrights ©2019-2020 ExpertsMind IT Educational Pvt Ltd