Reference no: EM132179039
Develop extendsim model to find the following. Please use ExtendSim 9
#1) A bank with five tellers opens its doors at 9 AM and closes its doors at 5 PM, but it operates until all customers in the bank by 5 PM have been served. Assume thatthe interarrival times of customers are exponentially distributed with a mean of1 min and that the service times of customers are exponentially distributed with amean of 4.5 min. In the current configuration, each teller has a separate queue (seeFigure 8.64). An arriving customer joins the shortest queue, choosing the shortestqueue furthest to the left in case of ties.The bank's management team is concerned with operating costs as well as thequality of service currently being provided to customers, and they are thinkingabout changing the system to a single queue. In the proposed system, all arrivingcustomers would join a single queue. The first customer in the queue goes to the firstavailable teller. Simulate 5 days of operation of the current and proposed systemsand compare their expected performance.
#2)Airline ticket counter-At an airline ticket counter, the current practice is to allow queues to form before each ticket agent. Time between arrivals to the agents is exponentially distributed with a mean of 5 min. Customers join the shortest queue at thetime of their arrival. The service time for the ticket agents is uniformly distributedbetween 2 and 10 min:
a.) Develop an ExtendSim model to determine the minimum number of agents thatwill result in an average waiting time of 5 min or less.
b.) The airline has decided to change the procedure involved in processing customersby the ticket agents. A single line is formed, and customers are routed to the ticket agent who becomes free next. Modify the simulation model in part (a) tosimulate the process change.Determine the number of agents needed to achievean average waiting time of 5 min or less.
c.) Compare the systems in parts (a) and (b) in terms of the number of agents neededto achieve a maximum waiting time of 5 min.
d.) It has been found that a subset of the customers purchasing tickets is taking along period of time.By separating ticket holders from non-ticket holders, managementbelieves that improvements can be made in the processing of customers.The time needed to check in a person is uniformly distributed between 2 and4 min. The time to purchase a ticket is uniformly distributed between 12 and18 min. Assume that 15% of the customers will purchase tickets and develop amodel to simulate this situation. As before, the time between all arrivals is exponentiallydistributed with a mean of 5min. Suggest staffing levels for both counters,assuming that the average waiting time should not exceed 5 min.
3) Grocery store-You are hired by Safeway to help them build a number of simulationmodels to better understand the customer flows and queuing processes ina grocery store setting. The pilotproject at hand focuses on an off-peak settingwhere at most two checkouts are open.To better understand the necessary levelof detail and the complexities involved, Safeway wants a wholebattery of increasinglymore realistic and complex models.For each model, Safeway wants to keep track of (i.e., plot) the average cycle time, queue length, and waiting time in thequeue. Tounderstand the variability, they also want to see the standard deviationof these three metrics.In addition, they would like to track the maximum waitingtime and the maximum number of customers in line. Furthermore, to betterunderstand the system dynamics, plots of the actual queue lengths over time arerequired features of the model. The off-peak setting is valid for about 4 h, so it isreasonable to run the simulation for 240 min. Furthermore, to facilitate an easierfirst-cut comparison between the models, a fixed random seed is recommended.Because Safeway plans to use thesedifferent models later, it is important that eachmodel sheet has a limit of one model:
a.) In the first model, your only interest is the queues building up at the checkoutcounters. Empirical investigation has indicated that it is reasonable to model thearrival process (to the checkout counters) as a Poisson process with a constantarrival intensity of three customers per minute. The service time in a checkoutstation is on average 30 s per customer and will, in this initial model, be consideredconstant. Inspired by the successes of a local bank, Safeway wants tomodel a situation with one single line to both checkout counters. As soon as acheckout is available, the first person in the queue will go to this counter. Afterthe customers have paid for their goods, they immediately leave the store.
b.) Upon closer investigation, it is clear that the service time is not constant but rathernormally distributed with mean = 30 s and standard deviation = 10 s. What is theeffect of the additional variability compared to the results in part (a)?
c.) To be able to analyze the effect of different queuing configurations, Safeway wantsa model in which each checkout counter has its own queue. When a customerarrives to the checkout point, he or she will choose the shortest line. The customeris not allowed to switch queues after making the initial choice. Can you see anydifferences in system performance compared to the results in part (b)?
d.) To make the model more realistic, Safeway also wants to include the time customersspend in the store walking around and picking up their groceries. Empiricalinvestigation has shown that there are basically two types of customers, and theyneed to be treated somewhat differently.
Type 1: The light shopper who buys only a few items (fewer than 15)
- About 60% of the customers arriving to the store.
- The shopping time follows a triangular distribution with a most likelyvalue of 5 min, aminimum value of 2 min, and a maximum value of 8 min.
- The service times for these customers at the checkout counter areexponentially
distributed with a mean of 15 s.
Type 2: The heavy shopper who buys several items (more than 15)
- Represents about 40% of the arriving customers.
- The shopping time is triangularly distributed with a most likely value of 10min, a minimum value of 5 min, and a maximum value of 15 min.
- The service times for these customers at the checkout counter are exponentiallydistributed with a mean of 52 s.
The total arrival process to the store is still a Poisson process with a mean of
three customers per minute. As for the queue configuration, Safeway feels that
the setup in b with one line for each checkout is better for psychological reasons;
one long line might deter customers from entering the store.
Modify the simulation model to incorporate the described elements and make it
more realistic. Analyze the performance of the current process using the performance
measures discussed earlier as well as the following additional measures:
- The time spent shopping (average and standard deviation)
- The number of customers (average and standard deviation)
- The separate cycle times for heavy and light shoppers (average and standard
deviation).
e.) To improve the service for the light shoppers, Safeway is thinking about dedicatingone of the checkout counters to this customer group. In other words,only light shoppers are allowed to use checkout 1. The other checkout (checkout2) will handle both heavy and light shoppers. However, empirical interviewsindicate that no light shopper will choose the regular lane unless atleast two more shoppers are waiting in line at the express lane. How does thisdesign change affect the cycle times for the two customer groups and for theaverage customer?
#4) Measuring cycle times of different types of jobs-Three types of jobs arrive to a processat a rate of four jobs per hour. The interarrival times are exponentially distributed.The arrivals are not equally likely for each job type. Typically, 40% of the jobs aretype I, 35% are type II, and 25% are type III. It can be assumed that all of the processingtimes are exponentially distributed; however, the mean times depend on the jobtype. Table 8.3 shows the mean processing time for the activities associated with eachjob type. (All times are given in minutes.)
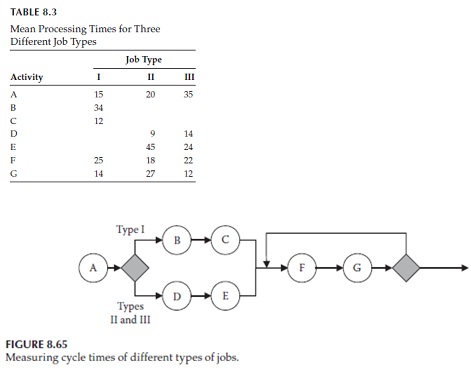
A flowchart of the process is depicted in Figure 8.65. Note that type I jobs are routedthrough activities B and C, and job types II and III are routed through activities D and E.The percentage ofrework also depends on the job type. About 5% of the type I jobsare reworked, about 4% of the type II jobs are reworked, and about 6% of the type IIIjobs are reworked. In terms of resources, the process has three types of workers.Five superworkers can handle any job; therefore, managers employ them to workon activities A, F, or G. Three type I specialists can handle only type I jobs; therefore,management employs them to work on activities B and C. Finally, three type IIand IIIspecialists can handle only type II and type III jobs; therefore, managementemploys them to work on activities D and E:
a.) Develop a simulation model for this process.
b.) Run the simulation for 250 h to generate approximately 1000 job arrivals andcollect data on cycle times for each job type separately.
c.) Assess the performance of the process based on your analysis in part (b).
#5) Investigating the effect of pooling resources-Three types of jobs arrive to a process at arate that randomly varies between 2 and 4 jobs/h; that is, the interarrival times aregoverned by a uniformdistribution with mean equal to three and a half jobs per hour.The process is currently configured in a way such that each arrival is sent to ateam of specialists according to the type of job. Each team consists of three members.A team performs three activities in order to complete each job, and any team membercan work on any of the three activities (A, B, or C). Figure 8.66 shows a flowchart ofthe process.
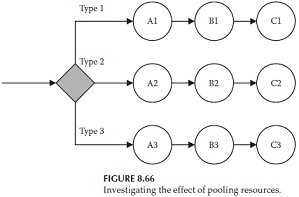
TABLE 8.4
Probability Distributions for Processing Times
|
Activity
|
Distribution
|
|
Job Type
|
|
|
1
|
2
|
3
|
|
A
|
Exponential
|
28
|
20
|
40
|
|
B
|
Normal
|
(34, 5)
|
(38, 7)
|
(21, 3)
|
|
C
|
Lognormal
|
(19, 3.5)
|
(28, 2.3)
|
(17, 3.1)
|
The arrivals are not equally likely for each job type. Typically, 30% of the jobs aretype 1, 35% are type 2, and 35% are type 3. Processing times (in minutes) associatedwith the activities depend on the job type and are summarized in Table 8.4.Management is concerned with the current performance of the process and is consideringcross-training the teams so team members can work on any job type:
a.) Develop a simulation model of this process that can be used to model 1 day ofoperation; that is, one run of the model will consist of 8 h of operation.
b.) Use your model to assess performance with the following measures: cycletimes, resource utilization, and overtime (the time needed to finish all jobsafter the process closes). Simulate 10 days of operation to collect data for youranalysis.
c.) Assume that the teams are cross-trained and that all nine people can performany of the activities in the process. Compare this design with the original processusing the measures in part (b).
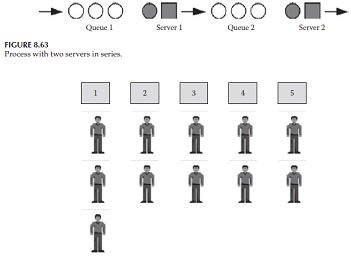
#6) Investigating the effect of rework rates-A proposed business process consists of fiveserialworkstations. One caseworker is positioned in each workstation. The processingtimes at eachworkstation are exponentially distributed with mean values of 11,10, 11, 11, and 12 min, respectively.The interarrival times are uniformly distributedbetween 13 and 15 min. The workstations have anunlimited queuing capacity, andit is assumed that the downstream transfer time is negligible. The unique aspect ofthis process is that between workstations 2 and 5, it is possible that the job will needto be reprocessed by the workstation immediately preceding the current one. For example, after workstation 3, it is possible that the job will be sent back to the queuein workstation 2. When this occurs, the transfer requires 3 min. The probability ofrework remains the sameregardless of the number of times a job is sent back forreprocessing.The rework probability is considered to be the same for all workstationsand is currently estimated to be between 5% and 10%:
a.) Develop a simulation model of this process that is capable of running 10,000 min of operation.
b.) Run 10,000 min of operation for rework probabilities of 5%, 6%, 7%, 8%, 9%, and10%. Collect cycle time data for each run.
c.) Construct a plot of the average cycle time (y-axis) versus the rework probability(x-axis). Also construct a plot of the maximum cycle time versus the reworkprobability.
d.) Assume that the processing times are constant. Run the simulation six times withthe rework probabilities in part (b).
e.) Construct plots of average cycle time and maximum cycle time versus the reworkprobability. Compare these plots with the ones obtained in part (c).
Attachment:- ExtendSim.rar