Reference no: EM132078457
Question 1:
Grocery store-You are hired by Safeway to help them build a number of simulation models to better understand the customer flows and queuing processes in a grocery store setting. The pilot project at hand focuses on an off-peak setting where at most two checkouts are open. To better understand the necessary level detail and the complexities involved, Safeway wants a whole battery of increasingly more realistic and complex models.
For each model, Safeway wants to keep track of (i.e., plot) the average cycle time, queue length, and waiting time in the queue. To understand the variability, they also want to see the standard deviation of these three metrics. In addition, they would like to track the maximum waiting time and the maximum number of customers in line. Furthermore, to better understand the system dynamics, plots of the actual queue lengths over time are required features of the model. The off-peak setting is valid for about 4 h, so it is reasonable to run the simulation for 240 min.
Furthermore, to facilitate an easier t-cut comparison between the models, a fixed random seed is recommended. Because Safeway plans to use these different models later, it is important that each model sheet has a limit of one model:
a. In the first model, your only interest is the queues building up at the checkout counters. Empirical investigation has indicated that it is reasonable to model the arrival process (to the checkout counters) as a Poisson process with a constant arrival intensity of three customers per minute. The service time in a checkout station is on average 30 s per customer and will, in this initial model, be con-sidered constant. Inspired by the successes of a local bank, Safeway wants to model a situation with one single line to both checkout counters. As soon as a checkout is available, the first person in the queue will go to this counter. After the customers have paid for their goods, they immediately leave the store.
b. Upon closer investigation, it is clear that the service time is not constant but rather normally distributed with mean = 30 s and standard deviation =10 s. What is the effect of the additional variability compared to the results in part (a)?
c. To be able to analyze the effect of different queuing configurations, Safeway wants a model in which each checkout counter has its own queue. When a customer arrives to the checkout point, he or she will choose the shortest line. The customer is not allowed to switch queues after making the initial choice. Can you see any differences in system performance compared to the results in part (b)?
d. To make the model more realistic, Safeway also wants to include the time customers spend in the store walking around and picking up their groceries. Empirical investigation has shown that there are basically two types of customers, and they need to be treated somewhat differently.
Type 1: The light shopper who buys only a few items (fewer than 15)
• About 60% of the customers arriving to the store.
• The shopping time follows a triangular distribution with a most likely value of 5 min, a minimum value of 2 min, and a maximum value of 8 min.
• The service times for these customers at the checkout counter are exponentially distributed with a mean of 15 s.
Type 2: The heavy shopper who buys several items (more than 15)
• Represents about 40% of the arriving customers.
• The shopping time is triangularly distributed with a most likely value of 14 min, a minimum value of 5 min, and a maximum value of 15 min.
• The service times for these customers at the checkout counter are exponentially distributed with a mean of 52 s.
The total arrival process to the store is still a Poisson process with a mean of three customers per minute. As for the queue configuration, Safeway feels that the setup in b with one line for each checkout is better for psychological reasons; one long line might deter customers from entering the store.
Modify the simulation model to incorporate the described elements and make it more realistic. Analyze the performance of the current process using the performance measures discussed earlier as well as the following additional measures:
• The time spent shopping (average and standard deviation)
• The number of customers (avenge and standard deviation)
• The separate cycle times for heavy and light shoppers (average and stan¬dard deviation)
e. To improve the service for the light shoppers, Safeway is thinking about dedicating one of the checkout counters to this customer group. In other words, only light shoppers are allowed to use checkout 1. The other checkout (check out 2) will handle both heavy and light shoppers. However, empirical interviews indicate that no light shopper will choose the regular lane unless at least two more shoppers are waiting in line at the express lane. How does this design change affect the cycle times for the two customer groups and for average customer?
Question 2:
Measuring cycle times of different types of jobs-Three types of jobs arrive to a process at a rate of four jobs per hour. The interarrival times are exponentially distributed. The arrivals are not equally likely for each job type. Typically, 40% of the jobs are type I, 35% are type II, and 25% are type III. It can be assumed that all of the processing times are exponentially distributed; however, the mean times depend on the job type. Table 8.3 shows the mean processing time for the activities associated with each job type. (All times are given in minutes.)
TABLE: Mean Processing Times for Three Different Job Types
|
Activity
|
|
Job Type
|
|
|
I
|
II
|
III
|
|
A
|
15
|
20
|
35
|
|
B
|
34
|
|
|
|
C
|
12
|
|
|
|
D
|
|
9
|
14
|
|
E
|
|
45
|
24
|
|
F
|
25
|
18
|
22
|
|
G
|
14
|
27
|
12
|
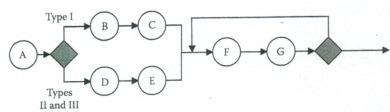
Figure: Measuring cycle times of different types of jobs.
A flowchart of the process is depicted in Figure 8.65. Note that type I jobs are routed through activities B and C, and job types II and HI are routed through activities D and E.
The percentage of rework also depends on the job type. About 5% of the type I jobs are reworked, about 4% of the type II jobs are reworked, and about 6% of the type HI jobs are reworked. In terms of resources, the process has three types of workers. Five superworkers can handle any job; therefore, managers employ them to work on activities A, F, or G. Three type I specialists can handle only type I jobs; there¬fore, management employs them to work on activities B and C. Finally, three type H and III specialists can handle only type H and type HI jobs; therefore, management employs them to work on activities D and E:
a. Develop a simulation model for this process.
b. Run the simulation for 250 h to generate approximately 1000 job arrivals and collect data on cycle times for each job type separately.
c. Assess the performance of the process based on your analysis in part (b).
Question 3:
Investigating the effect of pooling resources-Three types of jobs arrive to a process at a rate that randomly varies between 2 and 4 jobs/h; that is, the interarrival times are governed by a uniform distribution with mean equal to three and a half jobs per hour.
The process is currently configured in a way such that each arrival is sent to a team of specialists according to the type of job. Each team consists of three members. A team performs three activities in order to complete each job, and any team member can work on any of the three activities (A, B, or C). Figure shows a flowchart of the process.

Figure: The effect of pooling resources
TABLE: Probability Distributions for Processing Times
|
Activity
|
Distribution
|
|
Job Type
|
|
|
1
|
2
|
3
|
|
A
|
Exponential
|
28
|
20
|
40
|
|
B
|
Normal
|
(34, 5)
|
(38, 7)
|
(21, 3)
|
|
C
|
Lognormal
|
(19, 3.5)
|
(28, 2.3)
|
(17, 3.1)
|
(Mean, standard deviation)
The arrivals are not equally likely for each job type. Typically, 30% of the jobs are type 1, 35% are type 2, and 35% are type 3. Processing times (in minutes) associated with the activities depend on the job type and are summarized in Table 8.4.
Management is concerned with the current performance of the process and is considering cross-training the teams so team members can work on any job type:
a. Develop a simulation model of this process that can be used to model 1 day of operation; that is, one run of the model will consist of 8 h of operation.
b. Use your model to assess performance with the following measures: cycle times, resource utilization, and overtime (the time needed to finish all jobs after the process closes). Simulate 10 days of operation to collect data for your analysis.
c. Assume that the teams are cross-trained and that all nine people can perform any of the activities in the process. Compare this design with the original process using the measures in part (b).