Reference no: EM13241067
1. Dun & Bradstreet reports, among other things, information about new business incorporations and number of business failures over several years. Shown here are data on business failures and current liabilities of the failing companies over several years. Use these data and the following model to predict current liabilities of the failing companies by the number of business failures. Discuss the strength of the model.
y = β0β1xε
Now develop a different regression model by recoding x. Use Tukey's four-quadrant approach as a resource.
|
Rate of Business Failures (10,000)
|
Current Liabilities of Failing Companies ($ millions)
|
|
44
|
1,888
|
|
43
|
4,380
|
|
42
|
4,635
|
|
61
|
6,955
|
|
88
|
15,611
|
|
110
|
16,073
|
|
107
|
29,269
|
|
115
|
36,937
|
|
120
|
44,724
|
|
102
|
34,724
|
|
98
|
39,126
|
|
65
|
44,261
|
2. Given here are the data from a dependent variable and two independent variables. The second independent variable is an indicator variable with several categories. Hence, this variable is represented by x2, x3, and x4. How many categories are needed in total for this independent variable? Use a computer to perform a multiple regression analysis on this data to predict y from x values.
|
y
|
x1
|
x2
|
x3
|
x4
|
|
11
|
1.9
|
1
|
0
|
0
|
|
3
|
1.6
|
0
|
1
|
0
|
|
2
|
2.3
|
0
|
1
|
0
|
|
5
|
2
|
0
|
0
|
1
|
|
9
|
1.8
|
0
|
0
|
0
|
|
14
|
1.9
|
1
|
0
|
0
|
|
10
|
2.4
|
1
|
0
|
0
|
|
8
|
2.6
|
0
|
0
|
0
|
|
4
|
2
|
0
|
1
|
0
|
|
9
|
1.4
|
0
|
0
|
0
|
|
11
|
1.7
|
1
|
0
|
0
|
|
4
|
2.5
|
0
|
0
|
1
|
|
6
|
1
|
1
|
0
|
0
|
|
10
|
1.4
|
0
|
0
|
0
|
|
3
|
1.9
|
0
|
1
|
0
|
|
4
|
2.3
|
0
|
1
|
0
|
|
9
|
2.2
|
0
|
0
|
0
|
|
6
|
1.7
|
0
|
0
|
1
|
3. The U.S. Energy Information Administration releases figures in their publication, Monthly Energy Review, about the cost of various fuels and electricity. Shown here are the figures for four different items over a 12-year period. Use the data and stepwise regression to predict the cost of residential electricity from the cost of residential natural gas, residential fuel oil, and leaded regular gasoline.
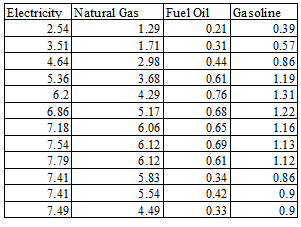
4. Study the three predictor variables in problem 3 and attempt to determine whether substantial multicollinearity is present between the predictor variables. If there is a problem with multicollinearity, how might it affect the outcome of the multiple regression analysis?
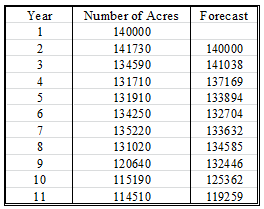
5. Figures for acres of tomatoes harvested in the U.S. from an 11-year period follow. The data are published by the U.S. Department of Agriculture. Compute MAD and MSE on these forecasts. Comment on the errors.
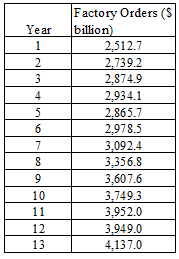
6. The U.S. Census Bureau publishes data on factory orders for all manufacturing, durable goods, and nondurable goods industries. Shown here are factory orders in the U.S. over a 13-year period ($ billion).
a. Use these data to develop forecasts for the years 6 through 13 using a 5-year moving average.
b. Use these data to develop forecasts for the years 6 through 13 using a 5-year weighted moving average. Weight the most recent year by 6, the previous year by 4, the year before that by 2, and the other years by 1.
c. Compute the errors of the forecasts in parts (a) and (b)
7. Shown below are dollar figures for commercial and industrial loans at all commercial banks in the U.S. as recorded for the month of April during a recent 9-year period and published by the Federal Reserve Bank of St. Louis. Plot the data, fit a trend line, and discuss the strength of the regression model. In addition, explore a quadratic trend and compare the results of the two models.
|
Year
|
Loans ($ billions)
|
|
1
|
741.0
|
|
2
|
807.4
|
|
3
|
871.3
|
|
4
|
951.6
|
|
5
|
1033.6
|
|
6
|
1089.8
|
|
7
|
1002.6
|
|
8
|
940.8
|
|
9
|
888.5
|
|
Why do humans engage in warfare
: Why do humans engage in warfare? is this a neccessary evil humans must endure? what are some of the justifications people and culture have given for engaging in armed conflict?
|
|
Use the given degree of confidence and sample data to
: Use the given degree of confidence and sample data to construct a confidence interval for the population mean x. Assume that the population has a normal distribution.
|
|
Your company asks you to compare a new advertising campaign
: Your company asks you to compare a new advertising campaign and the old one. Sample data on the accounts as follows:
|
|
Contributions from mayas-mexica-incas
: What are significant achievements/contributions from Mayas, Mexica, Incas, peoples of North America, or Polynesians
|
|
Develop a different regression model by recoding x
: Develop a different regression model by recoding x. Use Tukey's four-quadrant approach as a resource and computer to perform a multiple regression analysis on this data to predict y from x values.
|
|
Find the ratio r2/r1
: At a distance r1 from a point charge, the magnitude of the electric field created by the charge is 345 N/C. At a distance r2 from the charge, the field has a magnitude of 120 N/C
|
|
The law code of hammurabi
: Describe what the Law Code of Hammurabi reveals about Babylonian culture; consider relations between men and women, slaves and freemen.
|
|
Explain dry nitrogen dioxide gas
: If 5.00 grams of dry nitrogen dioxide gas (made wet because it was collected over water) were placed in a 5.00-L container, what will be the final pressure (in torr) in the container when the reaction is complete. Given: P of water = 23.76 torr at ..
|
|
Determine the magnitude of electron centripetal acceleration
: Suppose a single electron orbits about a nucleus containing two protons (+2e), as would be the case for a helium atom from which one of the naturally occuring electrons is removed, Determine the magnitude of the electron's centripetal acceleration
|