Reference no: EM13833457
Use the following table to answer Question 1. This table depicts the scores of 83 students on an exam worth 65 points.
1) Use the information in the table to determine the percentages for each interval.
Table: Grouped Frequency Table
|
Exam score
|
Frequency
|
Percentages for each Interval
|
|
60-62
|
3
|
|
|
57-59
|
9
|
|
|
54-56
|
21
|
|
|
51-53
|
18
|
|
|
48-50
|
14
|
|
|
45-47
|
10
|
|
|
42-44
|
8
|
|
2) When constructing a histogram and labeling the x- and y-axes, the lowest number on each axis should ideally be ________.
3) A frequency distribution that is bell-shaped, symmetrical, and unimodal is ______ _____.
4) A frequency distribution that has a tail trailing off to the right of the distribution is______ ______.
5) A frequency distribution of ages of residents at a senior citizen home is clustered around 83 with a long tail to the left. This distribution is _ ___________.
6) When a variable cannot take on values above a certain level, this is known as a(n) ___ ____ effect.
7) A grouped frequency table has the following intervals: 30-44, 45-59, and 60-74. If converted into a histogram, what would the midpoints be?
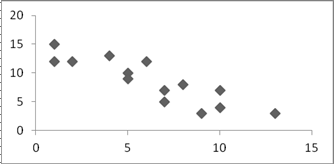
8) Do the data below show a linear relation, non-linear relation, or no relation at all?

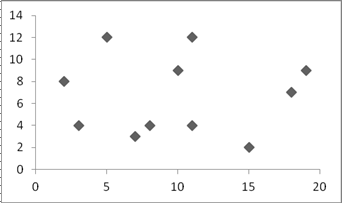
9) Do the data below show a linear relation, non-linear relation, or no relation at all?

Part I:
Question 10a- 10e
· At this website, (https://projects.newyorker.com/story/subway/) you will find an interactive graph concerning New York City's geography and income.
· Read the introduction and click on different "subway lines" to see how the interactive graph works.
· Note that the abbreviations stand for the four different boroughs:
§ MAN = Manhattan
§ BRX = Bronx
§ BRK = Brooklyn
§ QNS = Queens
· Also note that hovering your mouse over the dots on the graph displays the subway stop and the median income of households in that area.
10-a) In which of the four boroughs is the median household income highest? (This is made evident as you click on the different lines.)
10-b) Click on the "A" line. Does the line graph for Manhattan show high or low variability? What does this mean in terms of household income in this area of Manhattan?
10-c) Click on line 2. Which borough (not a street) shows the least variability in median household income?
10-d) On line 2, find the following two subway stops: Park Place (the first of the highest Manhattan stops) and E 180 St. (one of the lowest Bronx stops, located about halfway across the BRX section). What is the difference (calculate) between the median household incomes of the two areas?
10-e) Click on the "D" line. Which subway stop in Brooklyn seems to be an outlier.
Part II: SPSS Analysis
Green and Salkind, Lesson 20
· Open the "Lesson 20 Exercise File 1" document (found in the course's Assignment Instructions folder) in order to complete these exercises.
· Always use the Blackboard files instead of the files on the Green and Salkind website as some files have been modified for the purposes of this course.
· Reminder: For Exercise 1, be sure to paste in the SPSS output and write out the answers for A, B, and C beneath it.
Part II:
Questions 1-4
· Ann wants to describe the demographic characteristics of a sample of 25 individuals who completed a large-scale survey.
· She has demographic data on the participants':
Gender (two categories)
Educational level (four categories)
Marital status (three categories)
Community population size (eight categories).
Questions 1a -1c
1) Conduct a frequency analysis on the gender and marital status variables. From the output, identify the following:
a. Percentage of men
b. Mode for marital status
c. Frequency of divorced people in the sample
1-a) Percentage of men:
1-b) Mode for marital status:
1-c) Frequency of divorced people in the sample:
Questions 2-4
2) Create a frequency table to summarize the data on the educational level variable.
3) Create a bar chart to summarize the data from the community population variable.
4) Write a Participants section describing the participants in Ann's s ample.
Part II:
Questions 5-7
Open the "Lesson 20 Exercise File 2" document (found in the course's Assignment Instructions folder) in order to complete these exercises.
· Julie asks 50 men and 50 women to indicate what type of books they typically read for pleasure. She codes the responses into 10 categories: drama, mysteries, romance, historical nonfiction, travel books, children's books, poetry, autobiographies, political science, and local interest books.
· She also asks the participants how many books they read in a month. She categorizes their responses into four categories: nonreaders (no books a month), light readers (1-2 books a month), moderate readers (3-5 books a month), and heavy readers (more than 5 books a month).
· Julie's SPSS data file contains two variables: book (a 10-category variable for the type of books read) and reader (a 4-category variable indicating the number of books read per month).
5) Create a table to summarize the types of books that people report reading.
6) Create a pie chart to describe how many books per month Julie's sample reads.
7) Write a Participants section describing your results on the three variables.
Part III: SPSS Data Entry and Analysis
The steps will be the same in Part III as the ones you have been practicing in Part I of the assignment; the only difference is that you are now responsible for creating the data file as well. Remember to do the following:
· Name and define your variables under the "Variable View," then return to the "Data View" to enter the data; and
· Paste all SPSS output and graphs into your homework file at the appropriate place.
Part III:
Questions 1a-1c
· This question is based on the data in the end-of-chapter Question 2.30 of the Nolan and Heinzen textbook.
· Create a variable called "num_years" in a new SPSS file.
· Enter the data given in #2.30.
o Remember to enter the data into 1 column (variable).
1-a) Run a frequencies analysis that includes descriptive statistics for these scores (central tendency, dispersion, and distribution) and create a frequency table in SPSS for these data.
1-b) Create a histogram for these data.
1-c) How many schools have an average completion time of 8 years or less? An average completion time of 10 years or more?