Reference no: EM132308106
Assignment - Final Exam
Problem 1 - Circle True or False after carefully reading each statement.
(a) True or False - Ljung-Box Statistic check whether the autocorrelations of the time series indicates the adequacy of the Box-Jenkins Model.
(b) True or False - In an exponential smoothing model, the smoothing parameters close to 1 provides more weight to recent observations over the forecast.
(c) True or False - In an additive decomposition method, the average of irregular component is expected to be 1.
(d) True or False - Sum of weights in exponential smoothing is 1.
(e) True or False - The time series data with increasing (or decreasing) linear trend is stationary.
(f) True or False - If TPAC dies down and TAC has spikes at lag 2 and 3, the corresponding model is zt = δ + φ1zt-2 + φ3zt-3 + at.
(g) True or False - The second differences of the time series values y1, y2, . . . , yn are zt = 2yt - yt-1 + yt-2.
(h) True or False - Decomposition methods is used to decompose time series into the following factors: trend, seasonal, and cyclical.
(i) True or False - Additive Holt-Winters Method is used if the seasonal variation grows linearly.
(j) True or False - Autoregressive model does not need stationarity conditions.
Problem 2 - The past twenty monthly sales figures for a new type of watch sold at Ahn's stores are given in Excel File "Problem2.xlsx". The following questions are asked to forecast the future sales using an exponential smoothing method.
(a) Identify the name of an appropriate exponential smoothing method. Explain why?
(b) Determine parameters used in the exponential smoothing method. Use the first 12 observation to initialize.
(c) Find your forecast and 95% prediction intervals for year 2019 (y^25, y^26) by performing an approprate exponential smoothing procedure. Forcast and prediction interval must be obtained from your spreadsheet not from SAS (SAS will generate different estimates).
Problem 3 - The 178 monthly values for total number of drink sales (in millions) starts y1, y2, . . . , y178 in the US are presented in Excel File "Problem3.xlsx". The following question is asked to forecast the future sales using Box-Jenkins Method.
(a) Should the values in the data set be considered to have constant variance? Explain your answer.
(b) Should the values produced by the transformation either zt = yt - yt-1, zt = yt - yt-12, or zt = yt - yt-1 - yt-12 + yt-13 be considered stationary? Explain your answer.
(c) Do you need to include a constant term? Perform the statistical test and explain why.
(d) Identify your models at the non-seasonal level and at the seasonal level. Then, find and identify a tentative model for the time series yt. Give appropriate reasons why the model fits into the time series data. Your points depend on the fitness of the model and reasoning. (You must explain the behavior of SAC, SPAC, RSAC, or RSPAC, but need not include the picture of SAC, SPAC, RSAC, or RSPAC)
(e) Estimate the parameter of the model and perform diagnostic checking. (Diagnostic checking includes t-test of each parameter and Ljung Box Test of the model. Use α = 0.05).
(f) Forecast the point estimate and 95% prediction interval of values for the next four months.
Problem 4 - Consider the following time series
Xt = 0.5Xt-1 + 0.1Xt-2 + at
where at is independently normally distributed with mean 0 and variance σ2 (at ∼ N(0, σ2)). Answer the following question.
(a) This model is called the second-order auto regressive model. Show that the model satisfies the stationarity conditions.
(b) If we have obtained X0 = 5, X1 = 8, X2 = 10, what is the best approximation of X5?
Problem 5 - Below are the ACF and PACF for two time series. For each series, write the equation of the model. Support your answer with the explanation.
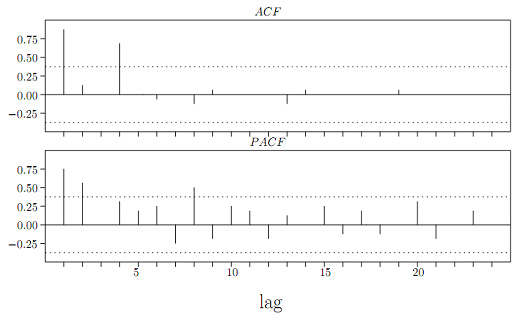
Model:
Reason:
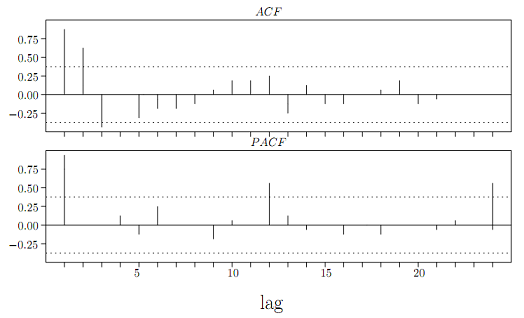
Model:
Reason:
Problem 6 - Consider the following time series
Xt = t + at + 0.5at-1
where at is independently normally distributed with mean 0 and variance σ2 (at ∼ N(0, σ2)). Answer the following question.
(a) Write the definition of stationarity.
(b) Now we transform the time series by taking the first difference.
Yt = Xt - Xt-1
Is Yt stationary? If yes, prove the stationarity of Yt using the definition of stationarity. If not, provide an appropriate reason.
Note - problem 2 and 3 can be done on excel.
Attachment:- Assignment Files.rar