Reference no: EM131842597
Measurement, Data Acquisition and Signal Processing Project
Objectives:
1- Design and simulate a data acquisition system.
2- Literature review of a selected interfacing standard used in instruments.
3- Understand the importance of calibration in measurement systems.
Part 1 -
Given the Data acquisition system shown in Fig. 1. It is required to design and simulate this system.
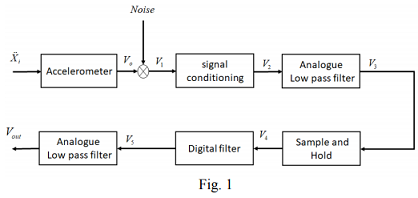
The system has the below properties:
1) The accelerometer is show in Fig. 2. It has a seismic mass M of 0.2 g and a spring constant K of 20,000 N/m. Its dynamic can be expressed by the following differential equation:
MX··o + BX·o + KXo = MX··i
Note:
a) X··o = d2Xo/dt2, X··i = d2Xi/dt2, X·o = dXo/dt
b) The unknown parameters must be estimated according to the instrument second order system.
c) Its displacement output Xo is connected to a relative displacement sensor (shown in Fig. 2) to produce an output voltage Vo = K/M Xo
2) The noise is a zero mean white Gaussian noise of power equals to 0.001 W.
3) The signal conditioning block is an OP-AMP whose output swing is ±5V.
4) The analogue filter(s) are used to reject high frequencies above 10fmax, where fmax is the highest input frequency that can be chosen as ωn/2π, where ωn is the natural frequency of oscillation. Use any method to design these filters.
5) The sample and hold circuit will be selected from simulator. Do not design this block. You need only to use the existing block and set its sampling frequency to 50 fmax.
6) The digital filter is a moving average filter used to reduce the effect of noise. You may select FIR or IIR filters.
Procedure of completing the requirements of Part 1:
1) Create a simulation environment of the system shown in Fig. 1. You may use MATLAB/SIMULINK or any other software packages such as PSpice. If you chose Simulink, the Simscape block libraries are useful to complete all tasks. Both Simulink/Simscape and PSpice are available in the computer Lab.
2) Find the transfer function of the accelerometer.
3) Plot the sinusoidal response and mark the cut-off frequency and static sensitivity.
4) Plot the accelerometer step response.
5) Design and simulate the signal conditioning amplifier. Show the schematic diagram and its frequency response.
6) Design and simulate the analogue filters. Show the schematic diagram and its frequency response.
7) Design and simulate the digital filters. Show the schematic diagram and time response. Compare the output V5 with V1. Discus the results.
8) Connect all blocks in Fig. 1 using the subsystem methods to reduce the complexity in schematic diagrams. Then simulate the system and record all outputs shown in Fig. 1.
9) Run the simulation by varying the input frequency of X··t and record the output voltage for each case. Then draw the sensitivity curve. Choose 5 passband frequencies only.
10) From step 8, estimate the overall measurement uncertainly.
11) From step 8, use the curve fitting method to estimate the system input output equation.
12) Explain -with illustrations- all above steps. Discus any differences you found.
Part 2 -
Make a literature review (three pages only) for three different state of the art interface standards used in instruments data acquisition system. Show comparison between these standards then write your conclusion.
Part 3 -
Explain (in a maximum of two pages) how the calibration procedure should be managed, particularly with regard to control of the calibration environment and choice of reference instruments.
References
[1] Measurement and Instrumentation Theory and Application, by Alan S. Morris and Reza Langari, 2012 Elsevier Inc.
[2] Robert B. Northrop. Introduction to instrumentation and measurements. Taylor & Francis Group, LLC, Second Edition, 2005.
[3] Ramon Pallaá S-Areny and John G. Webster. Sensors and signal conditioning. John Wiley & Sons, inc. 2nd Edition, 2000.
[4] Richard S. Figliola, Donald E. Beasley, 'Theory and Design for Mechanical measurements', Fifth Edition, John Wiley & Sons, Inc., 2011.
Report Preparation: Prepare your report in a professional way by writing short Introduction, Part 1, Part 2, Part 3. Attach results from simulation with the necessary figures and discussions. Provide a short conclusion.