Derive the expression for transfer function of this system

Assignment Help Other Engineering
Reference no: EM132205264

Questions -

Question 1: The block diagram in Figure 1 is a control schematic for a single area, controlled system where ΔPL is the change in the load demand and ΔF is resultant change in frequency

2402_figure1.png

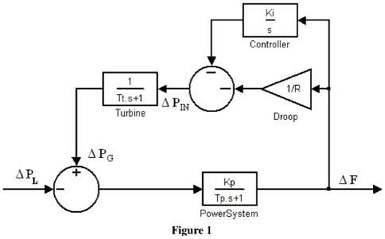
(a) Derive the expression for the transfer function of this system.

(b) If the turbine time constant Tt→0 this transfer function has the following form

ΔF/ΔPL = Ks/(s2+2ζωs+ω2)

Derive the overall gain, damping factor and natural frequency of the system.

(c) In the system shown in Figure 1, the gain of the power system shown is 100 and its time constant is 20 seconds. The droop of overall system is 4% on 50Hz. The integral controller gain is set at 0.3. Calculate the gain, natural frequency and the damping factor of the system.

Question 2: An interconnected system is shown Figure 2 ΔPLA(s) and ΔPLB(s) are the changes in the load demand in areas A and B respectively and ΔFA(s) and ΔFB(s) are the resultant changes in the frequency in each area.

1109_figure2.png

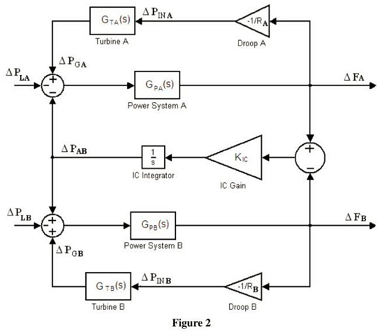
(a) The power transfer, ΔPAB(s) between area A and area B can be shown to be:

470_figure3.png

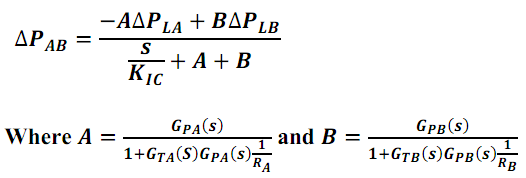
Show that the two areas settle to the same frequency deviation after the step changes in demand of MA p.u. MW in area A and MB p.u. MW in area B.

(b) Table 2 lists the parameters of the interconnected power system shown:

Parameter


Area A

Area B

Power system time constant

Tp

15s

25s

Power system gain

Kp

100

120

Turbine time consonant

TT

0.2s

0.1s

Droop [Hz/p.u. MW]

R

2

3

Table 2

Calculate the final frequency deviation in response to a step increases in demand of 0.01 p.u MW in Area A and 0.006 p.u. MW in Area B.

Question 3:

219_figure4.png

1500_figure5.png

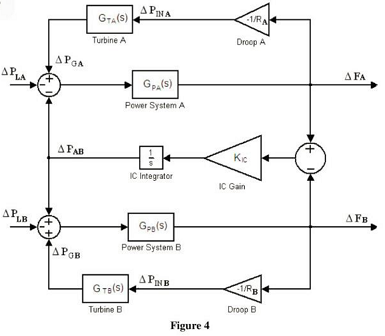
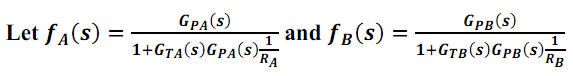
(a) Derive an expression for the power transfer ΔPAB, in the Laplace domain in terms of fA(s), fB(s), the interconnector gain KIC and the load changes ΔPLA and ΔPLB.

(b) Show that the two areas settle to the same frequency deviation after step disturbances occur in each area.

Reference no: EM132205264

Questions Cloud

What are the reasons person might fake orgasm : What are the reasons a person might fake an orgasm? Are men or women more likely to fake an orgasm? Why or Why not?
Success of an organization then the ability to be innovator : Does Wal-Mart become more important to the success of an organization then the ability to be an innovator?
Benefits to inventory control models outweigh the costs : What are some of the strengths and weaknesses you see in the inventory control models? Do the benefits to inventory control models outweigh the costs?
Derive transfer function and differential equation of system : The following circuit in Fig.1 is an example of band-reject or notch filter. Derive the transfer function and differential equation of the system in Fig.1
Derive the expression for transfer function of this system : The block diagram in Figure 1 is a control schematic for a single area, Derive the expression for the transfer function of this system
Determine the system impulse response in the time domain : Assignment - Physical System Modeling, Time Response and Stability. Determine the system impulse response in the time domain
Calculate the node voltages and all branch currents : ELEC270/ELEC670 Assignment Questions - Calculate the node voltages and all branch currents. Show your equations and solutions in a logical order
Summarize the ten payoffs for managing diversity well : Summarize the ten payoffs for managing diversity well. What are the real opportunities provided by this list in your opinion?
Determine the input and output impedances : Determine the input and output impedances for each circuits. Assume VGS = -2.0V in the circuit shown. If gm = 3000 µmho, what is the voltage gain

Reviews

Write a Review

Other Engineering Questions & Answers

  Develop the compressive stressverses axial strain plots

Develop the compressive stress (σa in psi) verses axial strain (ε in in. /in.) plots for both tests using equations 3, 4 and 5. Present these plots in the same graph for comparison.

  Draw a sequential fact diagram

Draw a Sequential Fact Diagram (SFD) based on the sources and the system map. Remember to include only those items for which evidence exists

  Demonstrate professional and ethical behaviour

MN502 - Overview of Network Security - develop skills to independently think of innovation - Demonstrate professional and ethical behaviour

  Explain the principles of approaches

Explain the principles of approaches that you would use to achieve them: (i) high strength and low work hardening rate, and (ii) very high strength and high

  Write the equations for lr and rr

Write the equations for LR and RR. Assume that BR overrides EM and that LT and RT override BR. Implement each function LR (BL, BR, EM, LT) and RR (BL, BR, EM, RT) with a 4-to-16-line decoder and external OR gates.

  Different signal-flow graphs can represent the same system

Which form facilitates the calculation of the variable gains during controller design?

  Write a proposal for a design of a new technological system

Designing Media Project: You will write a proposal for a design of a new technological system, or new application of an old system. The proposal will describe the system, and the reason for the system

  Determine delay for the cases

An RC circuit used to produce time delay is shown in Figure. For a step input voltage vi(t) = 2u(t) and C = 10 mF, determine Tdelay for the following cases: (a) R = 100 kΩ; and (b) R = 1 MW. Sketch the output vo(t) versus time for cases (a) and (b..

  Develop a work break down structure for project scheduling

DME600 Engineering Project Management and Lean Methodology Assessment. Develop a Work break down structure (WBS) for project scheduling from activity sheet

  Impose a time limit on entering the correct combination

Impose a time limit on entering the correct combination in that after the user enters the first symbol of the combination, he or she has five seconds to enter the entire sequence.

  How is this ensemble different from an rf

How is this ensemble different from an RF? Using sklearn, produce a bagging classifier that behaves like an RF. What parameters did you have to set up?

  How the dp flow measurement transducer operates

How the DP flow measurement transducer operates and how the DP flow transmitter vertical works?

Free Assignment Quote

Assured A++ Grade

Get guaranteed satisfaction & time on delivery in every assignment order you paid with us! We ensure premium quality solution document along with free turntin report!

All rights reserved! Copyrights ©2019-2020 ExpertsMind IT Educational Pvt Ltd