Reference no: EM132228628
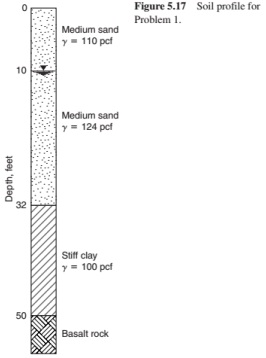
Problem 1 The sequence of soils at a site is shown in Figure 5.17. Calculate the total pressure, water pressure, and effective pressure on horizontal planes at each change of soil type, and at the groundwater table. Show your results on a sketch, indicating the variations of each of these pressures with depth.
Problem 2 A series ot three experiments was run on a single sample using apparatus like that shown in Figure 5.2. Q was 60 cm3, L was 12 cm, and A was 25 cm2. Paired values of H and r are in the following table:
|
H
|
t (sec)
|
|
20
|
140
|
|
40
|
73
|
|
60
|
50
|
Demonstrate the validity of Darcy's law in this instance. Estimate the coef-ficient of permeability of the sample.
Problem 3 Assume the consolidation test data that are given in Problem 7 from Chapter 5 of Schroeder et al. apply to a clay layer that is located beneath a project site where you are involved in constructing a 3-story building. The clay layer is 3-foot thick, and the top of the layer is 15 feet below ground surface.
Before construction, it is estimated that the stress in the middle of the clay layer is 1 ton/ft2. The load of the building will place an additional 1 ton/ft2 on the clay layer. Find the settlement of this layer due to the increased load.
Extra credit if you plot the consolidation data.
Q: Data from a one-dimensional consolidation test are presented in the following table:
| Consolidating Pressure(tsf) |
Void Ratio |
| 1/8 |
1.87 |
| 1/4 |
1.86 |
| 1/2 |
1.84 |
| 1 |
1.81 |
| 2 |
1.76 |
| 4 |
1.66 |
| 8 |
1.51 |
| 16 |
1.32 |
| 4 |
1.36 |
| 1 |
1.44 |
| 1/4 |
1.49 |
Plot the void ratio-pressure relationship and estimate the compression index far both the virgin compression cane and the recompression curve.
Problem 4
Consider the data from an unconfined compression strength test on a clay sample that are given in Problem 9 from Chapter 5 of Schroeder et al. Using the peak axial stress measured for the undisturbed sample as the unconfined compressive strength, find the cohesion in psi and in ton/ft2. Repeat for the remolded sample. Comment on the difference in strength and cohesion of undisturbed and remolded sample.
Q. Data from unconfined compression tests on a sample (one test on the undisturbed sample, one on the slime sample remolded) are shown in the following table:
|
Axial Strain
(%)
|
Undisturbed
Axial Stress
(psi)
|
Remolded
Axial Stress
(psi)
|
|
0
|
0
|
0
|
|
2.
|
6.1
|
1.4
|
|
4
|
6.8
|
2.5
|
|
6
|
6.9
|
3.2
|
|
8
|
6.9
|
3.7
|
|
10
|
6.8
|
4.2
|
|
12
|
6.7
|
4.5
|
|
14
|
6.6
|
4.7
|
|
16
|
6.5
|
4.8
|
|
12
|
|
5.0
|
|
20
|
|
5.1
|
Attachment:- Chapter.rar