Demonstrate that your ann works correctly

Assignment Help Basic Statistics
Reference no: EM131936875

Assignment - Simple Classifiers

General Instructions

This assignment is individual work. You may discuss questions and problems with anyone, but the work you hand in for this assignment must be your own work.

- Each question indicates what to hand in.
- Do not submit folders, or zip files, even if you think it will help.
- Assignments must be submitted to Moodle.

Question 1:

Purpose: To practice using Variable Elimination on non-trivial examples. Consider the Bayesian network given below.
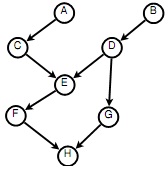
897_network.jpg

Write out a formula for each of the following queries, using technique called variable elimination shown in class. There are no probabilities given, so leave you answer in algebraic form. Choose any order for the marginalization; there is no need to determine the "optimal" order. Be sure to consider conditional independence, and relevance, as in A3!

(a) P(G|C)
(b) P (B|A, F)

Question 2:

Purpose: To work through the equations for a Linear Classifier.

Consider the following diagram, showing 4 data points in the x1, x2 plane.
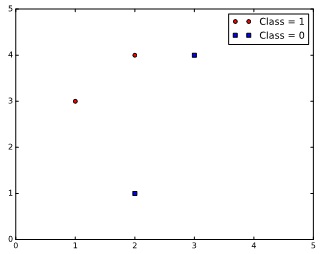
1283_diagram.jpg


(a) Give a pair of values (m1, b1) that defines a line that separates the two classes. Use the function h() defined in the notes:

h(x1, x2, m, b) = 1  if x2 - (mx1 + b) ≥0; 0 otherwise

to demonstrate that your line separates the two classes by showing that all the points for the red class are on one side of the line, and all the points for the blue class are on the other.

(b) Take one point from the data, and use the "Perceptron Learning rule" to demonstrate the update of your choice for (m1, b1). Use an arbitrary α; it can be α = 0.1, just to keep math simple. You only need to show the change in (m1, b1) using the rule once, on one data point.

(c) Give a pair of values values (m2, b2) that defines a line that does not separate the two classes (any line where at least one point is misclassified will do). As in part (a), demonstrate that your line does not separate the two classes by showing one or more of the points from one of the classes is on the "wrong" side of the line.

(d) Take one of the misclassified points from the data (depending on your choice of (m2, b2)), and use the "Perceptron Learning rule" to demonstrate the update of your choice for (m2, b2) with that point. Use an arbitrary α; it can be α = 0.1, just to keep math simple. You only need to show the change in (m2, b2) using the rule once, on one data point.

Question 3:
Purpose: To work through the equations for a Logistic Regression Classifier. Consider the following diagram, showing 5 data points in the x1, x2 plane.
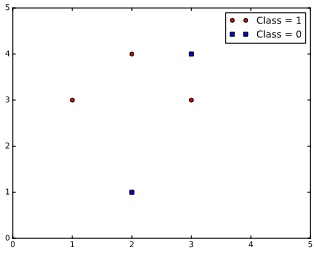
2270_diagram1.jpg

(a) Using your (m1, b1) from Question 1, demonstrate the output of the Logistic classifier on all 5 data points. Use the logistic classifier h() defined in the notes:

h2(x1, x2, m, b) = 1/(1 + e-(x2 -mx1 -b))

(b) Using the Logistic Regression Learning rule, your (m1, b1) from Question 1, and the point (3, 3), demonstrate the effect of the the learning rule by calculating the new values for (m1, b1).

Let's use v as an abbreviation:

v = h2(xi1, xi2, m, b)

The Logistic Regression Learning rule is as follows.

m = m - α xi1 (yi - v) v (1 - v)

b = b - α (yi - v) v (1 - v)

(c) Using your updated (m1, b1) from the previous part, demonstrate the output of the Logistic classifier on all 5 data points.

Question 4:

Purpose: To work through the equations of the simple perceptron classifier.

Consider the following diagram, showing 4 data points in the x1, x2 plane.
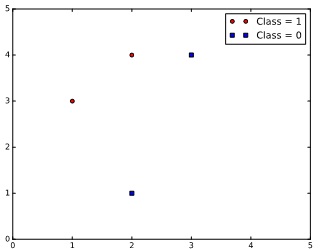
2416_diagram2.jpg

This data is the same as in Question 2.

(a) Construct a perceptron with one unit, and one output value, that correctly classifies the data.

You could use the following as your basic architecture (but you are not bound to use this one).

861_diagram3.jpg

This is an exercise in understanding how perceptrons work; don't do back propagation or anything. Try to figure out how many inputs your perceptron needs, and what weights will give you the right answer as the output. Use Step as your activation function here (not Sigmoid).
Hint: Use Question 1!

(b) Demonstrate that your perceptron works correctly by showing its output on all 4 data points.

Question 5:

Purpose: To work through one step of the back propagation algorithm for Artificial Neural Networks.

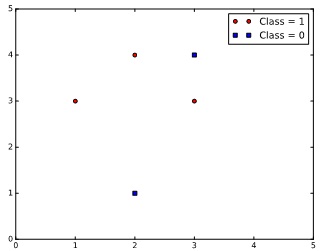
Consider the following diagram, showing 5 data points in the x1, x2 plane.
364_diagram4.jpg

This data is the same as in Question 3.

(a) Construct a 2-level feedforward neural network to classify the 5 data points. Your network should have 2 input units, and one output unit, with up to 3 weights on each unit. Use the Step function as the activation function for all units. There will be no hidden layer here.
The following is a diagram of what you could use. Note that each unit is a perceptron as in Question 3.
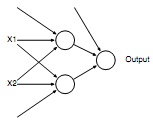
2450_diagram5.jpg

The problem is to figure out what weights to use to build this network to get all 5 data points right.

(b) Demonstrate that your ANN works correctly by showing its output on all 5 data points.

Reference no: EM131936875

Questions Cloud

Describe in brief salient features of amd opteron processor : Describe in brief salient features of the AMD Opteron processor. Comment briefly on whether such a processor should provide hardware support for multithreading.
At what sales quantity per year will the investment break : The sales price is set at $19.95 a unit, the annual fixed costs are $237,000 and variable cost per unit is $8.87. The tax rate is 34% and the discount rate is 1
Calculate causer debt-to-capital ratio : Calculate Causer's debt-to-capital ratio assuming the firm uses only debt and common equity, so total assets equal total invested capital.
Number of individuals of the yellow-ruffed : Let V(t) be the number of individuals of the yellow-ruffed mice as a function of time 't'.
Demonstrate that your ann works correctly : Assignment - Simple Classifiers - Demonstrate that your ANN works correctly by showing its output - Demonstrate that your perceptron works correctly
What is the value of the firm based on current earnings : Assume your firm is expected to grow at 3 percent for the foreseeable future. Given that the interest rate is 5 percent, and that the firm's current profits.
What type of variants can affect the transcript : What type of variants can affect the transcript's protein product but are not in the translated sequence?
Describe the salient features of tieras system-on-a-chip : Describe the salient features of Tiera's TILE64 system-on-a-chip, and the use of 'Mesh network to realize cache coherent NUMA architecture.
Should investment managers of bond funds employ credit : Should investment managers of bond funds employ credit analysts when there are public ratings on so many bonds issued by the rating agencies?

Reviews

len1936875

4/10/2018 7:02:11 AM

Show at least some of your work, so we can tell that you are using the formula correctly. • The output of the logistic classi2er on all 5 points before and after modifying (m1, b1). • A demonstration of the logistic regression learning rule. Evaluation 1.(1 mark) You correctly applied the logistic classi2er on all 5 of the given data points. 2.(2 marks) You correctly applied the Logistic Regression Learning rule to your (m2, b2) with one of the given data points. 3.(1 mark) You correctly applied the logistic classi2er on all 5 of the given data points using your updated (m1, b1).

len1936875

4/10/2018 7:02:01 AM

Show at least some of your work, so we can tell that you are using the formula correctly. • Two choices for (m, b) as described. • Two demonstrations about how h() classi2es or misclassi2es the given data points. • Two simple applications of the perceptron learning rule. Evaluation 1.(2 marks) Your line separates the two classes. The demonstration shows this clearly. 2.(2 marks) You correctly applied the Linear Classi2er update formulae to your (m1, b1) with one of the given data points. 3.(2 marks) Your line does not separate the two classes. The demonstration shows this clearly. 4.(2 marks) You correctly applied the Linear Classi2er update formulae to your (m2, b2) with one of the given data points.

len1936875

4/10/2018 7:01:49 AM

What to Hand In • Two derivations for the queries above. Evaluation • For each query: – 2 marks: you expressed the query in terms of a joint distribution of the relevant variables. – 1 mark: You factorized the joint distribution correctly. – 1 mark: You distributed the marginalization correctly.

Write a Review

Basic Statistics Questions & Answers

  Statistics-probability assignment

MATH1550H: Assignment:  Question:  A word is selected at random from the following poem of Persian poet and mathematician Omar Khayyam (1048-1131), translated by English poet Edward Fitzgerald (1808-1883). Find the expected value of the length of th..

  What is the least number

MATH1550H: Assignment:  Question:     what is the least number of applicants that should be interviewed so as to have at least 50% chance of finding one such secretary?

  Determine the value of k

MATH1550H: Assignment:  Question:     Experience shows that X, the number of customers entering a post office during any period of time t, is a random variable the probability mass function of which is of the form

  What is the probability

MATH1550H: Assignment:Questions: (Genetics) What is the probability that at most two of the offspring are aa?

  Binomial distributions

MATH1550H: Assignment:  Questions:  Let’s assume the department of Mathematics of Trent University has 11 faculty members. For i = 0; 1; 2; 3; find pi, the probability that i of them were born on Canada Day using the binomial distributions.

  Caselet on mcdonald’s vs. burger king - waiting time

Caselet on McDonald’s vs. Burger King - Waiting time

  Generate descriptive statistics

Generate descriptive statistics. Create a stem-and-leaf plot of the data and box plot of the data.

  Sampling variability and standard error

Problems on Sampling Variability and Standard Error and Confidence Intervals

  Estimate the population mean

Estimate the population mean

  Conduct a marketing experiment

Conduct a marketing experiment in which students are to taste one of two different brands of soft drink

  Find out the probability

Find out the probability

  Linear programming models

LINEAR PROGRAMMING MODELS

Free Assignment Quote

Assured A++ Grade

Get guaranteed satisfaction & time on delivery in every assignment order you paid with us! We ensure premium quality solution document along with free turntin report!

All rights reserved! Copyrights ©2019-2020 ExpertsMind IT Educational Pvt Ltd