Reference no: EM131030003
A Process Map for a local service operation:
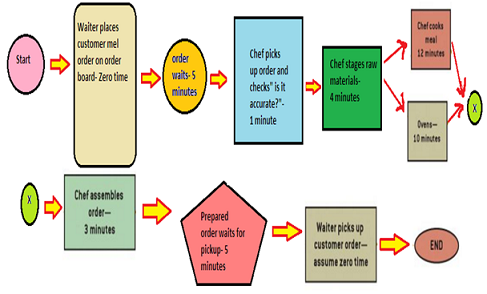
Calculation for cycle time:
Cycle time = 5 +1+4+12+3+5 = 30 minutes per order
Calculation for Process capacity:
Process capacity = 1 / Cycle time
= 1 / 30
= 0.03333
= 3.33%
Calculation for Utilization:
Utilization = Flow Rate/ Capacity
= 2/ 3.33
= 0.6 = 60%
Analysis of the process
Process Mapping
A process map is a tool that aids in defining and understanding a process. It is helpful to represent the path which one is used to produce an output. This makes it one of the most powerful process improvement tools. A process map alone can identify many process problems. It also becomes a template for metric information such as cycle time, defect rate, and roll throughput yield (covered later in this material). A process map is also a standardization tool. In the Control Phase of an improvement project, the process map documents how work is to flow and the expected cycle times. The map can then help process owners react to changes in the environment in a way that does not increase the process' defect rate. Building a process map has three stages.
1. First, the team brainstorms the steps in the process. All steps are to be included, no matter how great the temptation is to leave some out. If the team leaves any step out, the result will not be an as-is process map and will not be useful.
2. Second, the process steps are organized according to sequence and responsibility. The team can do this with sticky notes on a wall so that they can make changes easily. Another aspect of this second stage is to determine the nature of each process step. There are decision points, manual or auto-mated steps, handoff points, and so forth. These will help point the way to defects.
3. The third stage is to take the above information and put it in the form of a process map using the symbols mentioned below. For simplification, be consistent with the direction of the chart and the use of symbols.
As per the above process map, waiter takes order on order board-zero time. After that within 30minutes the order reached to the table of customer. These 30 minutes are distributed at different levels of work in process. The main issue what I find is that there is no direct conversation between chef and the waiter. Waiter collects order and there is no recheck with him by chef etc.
Capacity of the product is 3.33%, which is more than average and the utilization is 60%. I would like to recommend if the time taken in waiting after and before the order it will be more beneficial.
Attachment:- Assignment.rar
|
What are special communication issues facing single parents
: What are some of the special communication issues facing single parents? How can these issues be handled most constructively? Use the text plus 2 other sources to support your response.
|
|
Discussion and reflective thinking
: Describe how a strike by the Teamsters against UPS would affect that company's various stakeholders. Would the current political landscape make a difference? Explain. Union membership has been declining in the U.S. private sector for many years. What..
|
|
Forecasts are better than they really-decision-making bias
: Audrey tends to believe that her forecasts are better than they really are. This illustrates a? decision-making bias known as? ________.
|
|
Operations management-model assumption
: Operations Management (10th edition) A store faces demand for one of it popular at a constant rate of 9,000 units per year. It costs the store $120 to process an order to replenish stock and $30 per unit per year to carry the item in inventory. The s..
|
|
Defining and understanding a process
: Analysis of the process - Process Mapping, A process map is a tool that aids in defining and understanding a process. It is helpful to represent the path which one is used to produce an output
|
|
Give an overview of the delta pacific case study
: Give an overview of the Delta Pacific case study, listing at least three key takeaways of what you gleaned from the study. Share two separate contingency models that could be used to affect the organizational change and share which model you plan ..
|
|
Write essay for tenth annual creative writing prose contest
: Write an essay for 10th Annual Creative Writing Prose Contest. Submit one work of fiction or narrative non-fiction. A maximum of 1.000 words. typed double spaced. 12-point standard font.
|
|
Does the current level of customer satisfaction differ
: Does the current level of customer satisfaction differ from management's goal of 6 out of 10? Is there any difference between the satisfaction of male and female customers with the response time of the CompleteCare division
|
|
Identify the possible potential faults disorders impactsor
: Beach Beauties Corporation (BBC), is a regional wholesaler of women's swimwear andbeach attire. The company is located in Jacksonville, Florida, and it sells to retail stores inresort communities in Florida, Georgia, and the Carolinas.
|