Reference no: EM132297054
Public Health Assignment Questions -
Q1. Apply the following questions to titanic_train (a dataset from package titanic).
a. Create a plot to show the male and female portion in different class.
b. Create a plot to show the male and female portion in survived passengers (Survived column).
c. Remove missing values in Age column. Then create a boxplot to show the age (Age column) in survived passengers (Survived column).
d. Create a scatter plot to show the age (Age column) in survived passengers (Survived column).
e. What is your conclusion from the six plots you generated? For example, gender difference in survived passengers.
Q2. a. Subset titanic_train with columns named "Survived", "Pclass", "Sex", "Age", and "Fare" into titanic_train.2.
|
Survived
|
Pclass
|
Sex
|
Age
|
Fare
|
|
0
|
3
|
male
|
22
|
7.2500
|
|
1
|
1
|
female
|
38
|
71.2833
|
|
1
|
3
|
female
|
26
|
7.9250
|
|
1
|
1
|
female
|
35
|
53.1000
|
|
0
|
3
|
male
|
35
|
8.0500
|
|
0
|
3
|
male
|
NA
|
8.4583
|
b. Subset titanic_train with columns named "Survived", "Pclass", and "Age" into titanic_train.3. Then melt titanic_train.3 into titanic_train.3_m using columns named "Survived" and "Pclass".
|
head (titanic_train.3)
|
|
head (titanic_train.3_m)
|
|
Survived
|
Pclass
|
Age
|
|
Survived
|
Pclass
|
variable
|
value
|
|
0
|
3
|
22
|
|
0
|
3
|
Age
|
22
|
|
1
|
1
|
38
|
|
1
|
1
|
Age
|
38
|
|
1
|
3
|
26
|
|
1
|
3
|
Age
|
26
|
|
1
|
1
|
35
|
|
1
|
1
|
Age
|
35
|
|
0
|
3
|
35
|
|
0
|
3
|
Age
|
35
|
|
0
|
3
|
NA
|
|
0
|
1
|
Age
|
54
|
c. dcast titanic_train.3_m into titanic_train.3_d using mean.
|
Survived
|
Age
|
|
0
|
30.62618
|
|
1
|
28.34369
|
d. Use r to confirm your mean in Q2.c is correct.
e. Tally the number of male and female in both survived and not survived passengers and see if it matches the plot in Q1.b.
|
Survived
|
Sex
|
|
female
|
male
|
|
0
|
81
|
468
|
|
1
|
233
|
109
|
Q3.
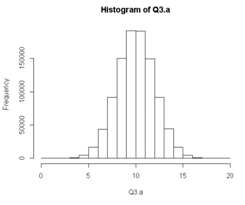
a. Generate 1,000,000 random numbers from normal distribution with standard deviation equal to 2 and mean equal to 10.
b. Create a histogram using r function (not ggplot2).
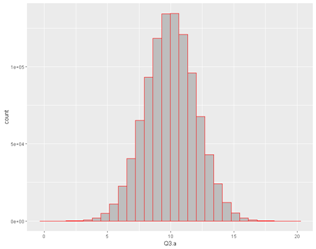
c. Create a histogram using ggplot2. If there is an error, please explain it.
d. Correct the error and create a histogram using ggplot2 and bins=30.
e. Compare the standard deviation and mean in your data to the parameters you used to create your data in Q3.a.
Q4. a. Generate 15 random numbers from 1 to 100 with and without replacement.
b. Apply a t-test to the two group of numbers from Q4.a and Q4.b assuming different variance and not paired t-test.
c. If you plan to generate exactly same random numbers in Q4.a later, what will you do differently in your codes?
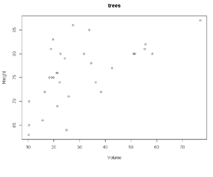
Q5. Apply the following questions to trees (an R dataset).
a. Make a scatter plot to show the relationship between Volume and Height.
b. Build a linear model with Volume as the predictor and Height as the response.
c. Based on the linear model in Q5.b, what is the Height if the Volume is 30?
d. Draw a trend line with abline with red color.
Attachment:- Assignment File.rar