Reference no: EM13847780
Construct a boxplot to show the difference between the mean scores of the 2 groups.
Construct a boxplot to show the difference between the mean scores of the 2 groups.
Construct a boxplot to show the difference between the mean scores of the 2 groups.
Compute descriptive statistics by diagnosis (that is, for each of the two groups in one table)
These questions are based on the Nolan and Heinzen reading and end-of-chapter questions
1. What are always the mean and standard deviation of the z-distribution?
2. Define the central limit theorem.
3. Fill in the blanks (1 pt): A z-score can be thought of as the number of _______ that a score is from the mean.
4) Calculating z scores from raw scores: If a population has a mean of =235 and a standard deviation of = 38, calculate z scores for each of the following raw scores (X) from this population. Show work on the right hand side, put s on the left in the space provided.
4a) X = 350; Z =........
4b) X = 267; Z =........
4c) X = 142; Z =..........
4d) X = 49; Z =............
5) Calculating raw scores from z scores: If a population has a mean of =235 and a standard deviation of = 38, calculate raw scores (X) for each of the following z scores from this population. Show work on the right hand side, put s on the left in the space provided.
5a) Z = .57; X =
5b) Z = -2.56; X =
5c) Z = -1.0; X =
5d) Z = 1.83; X =
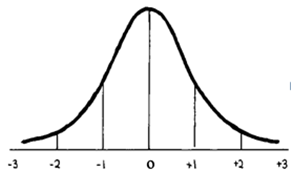
6) In a normal curve, what percentage of scores falls:
6a) Above the mean?
6b) Between -1 and +1 standard deviations (SD) from the mean?
6c) Beyond 2 SD's away from the mean (on both sides)?
6d) Between the mean and 2 SD's above the mean?
7) Compute the standard error (m) for each of the following sample sizes, assuming a population mean of 120 and a standard deviation of 25.
7a) 50
7b) 150
7c) 5500
8) Compute a z-statistic for each of the following sample means, assuming the population has a mean of 100 and a standard deviation
of 30 (Remember to compute M before computing the z statistic!)
8a) A sample of 42 scores has a mean of 115
8b) A sample of 80 scores has a mean of 92
8c) A sample of 26 scores has a mean of 100 Part II:
PART 2
Using the data set ( s will be pasted into the blanks below this summary):
• a) Create a histogram of the raw scores
• b) Transform the raw scores to z-scores
o Label the new variable "z_anxiety"
• Paste Descriptive Statistics Table of the raw anxiety scores
o Note that descriptive statistics should describe the original raw scores and not the new z scores
• c) Identify the z-score that is closest to 0 and farthest from 0.
• d) Evaluate whether the scores are normally distributed.
o Support your .
1a) Create a histogram of the anxiety raw scores and paste it below.
1b) Using the descriptives method covered in the presentation and chapter, transform the anxiety raw scores to z-scores, creating a new variable called "z_anxiety."
These descriptive statistics should describe the original raw scores and not the new z-scores.
1c) What is the z-score that is closest to 0 (on either side of the mean) in the data set?
What is the z-score that is the farthest from 0 (on either side of the mean) in the data set?
1d) Based on the histogram from (1a) and your other s above, would you describe the anxiety data as being normally distributed? Why or why not? Support your with information from the chapter and presentations regarding normal and standard normal z-distributions.
Part III:
SPSS Data Entry and Analysis
Data provided below.
|
IQ Scores
|
|
79
120
104
145
108
100
115
107
60
122
105
87
98
124
82
|
93
89
123
117
104
112
96
88
98
105
91
113
123
124
90
|
Part III:
Questions 1a-1e
The data in the columns to the left represent IQ scores of a sample of 30 high school students. In the general population, IQ scores have a mean of 100 and a standard deviation of 15. Enter this data into SPSS. Be sure to save this file, since you will be using it next week as well.
•Generate descriptive statistics for this variable.
• Generate a histogram for this variable.
• Choose 1 measure of central tendency and 1 measure of dispersion (variability) that best describes the data set.
o Support your .
• In your data set, standardize the IQ scores by transforming them into z-scores
o Label the new variable "ZIQ"
• Which z-scores corresponds to a raw IQ score of 115, 60 and 104?
• Does the distribution reflect the distribution in the general population?
o Support your .
1-a) Generate descriptive statistics for this variable.
1-b) Generate a histogram for this variable.
1-c) Choose 1 measure of central tendency and 1 measure of dispersion (variability) that best describes the data set.
Justify why you chose these measures in a statement beneath the output.
1-d) In your data set, standardize the IQ scores by transforming them into z-scores under a new variable "ZIQ."
Using your data set as a reference, what z-score corresponds to a raw IQ score of 115?
To a raw IQ score of 79? To a raw IQ score of 107?
115 79 107
1-e) Based on what you have been told about IQ scores in the beginning of the problem,
does this sample's distribution seem to reflect the distribution of IQ scores in the general population?
Why or why not?
Part IV: Cumulative
Data provided below for respective questions.
Part IV: Question 1a-1d (Non-SPSS)________________________________________
A cognitive psychologist wants to find out whether playing Minecraft® affects fourth graders' scores on a visuospatial task.
He assigns 30 fourth graders to 1 of 2 groups.
Group 1 plays Minecraft® for 20 minutes, then completes the visuospatial task.
Group 2 completes the visuospatial task without playing Minecraft®.
1-a) What is the independent variable in this experiment?
1-b) What is the dependent variable?
1-c) What is the likely null hypothesis for this experiment?
1-d) What is the likely research hypothesis for this experiment?
Part IV: Question 2a & 2b (Non-SPSS)________________________________________
A clinical psychologist wants to see whether there is a difference in depressed mood between clients in a new long-term treatment program for people diagnosed with Major Depressive Disorder, as compared to clients in the standard treatment program for MDD at her clinic. She assigns 20 participants to the new treatment program and 20 participants to the standard treatment program.
2-a) State the likely null hypothesis for this study.
2-b) State the likely research hypothesis for this study.
|
ASPD
Diagnosis
|
No ASPD
Diagnosis
|
|
25
10
20
21
27
9
16
27
34
31
|
9
8
19
14
6
5
8
15
10
4
|
Part IV:
Questions 3a & 3b (SPSS)
A forensic psychologist wants to examine the level of narcissistic personality traits in those who are diagnosed with antisocial personality disorder (ASPD) and those who do not qualify for ASPD within a local prison population. She administers a measure of narcissistic personality traits where higher scores indicate higher levels of narcissism and scores range from 0-35.
• Create a new SPSS data file for these scores.
• Your file must have 2 variables: Diagnosis and Score.
• Your diagnosis variable must be set up as a 1-column grouping variable with 2 groups (diagnosis, no diagnosis) coded numerically. This will be much like the gender variable you created in a previous module/week.
o For example, if you code ASPD Diagnosis as 1 and No ASPD Diagnosis as 2, then the SPSS file will appear somewhat like the following:
|
Column 1
|
Column 2
|
|
"Diagnosis"
|
"Score"
|
|
1
|
23
|
|
1
|
11
|
|
1
|
19
|
All ASPD Diagnosis scores from the table above will appear in a similar fashion
Then, continuing in the same columns, enter No ASPD Diagnosis information as:
|
Column 1
|
Column 2
|
|
2
|
10
|
|
|
2
|
8
|
|
|
2
|
19
|
|
|
|
|
|
[Continue in this fashion to the end of the file]
• a) Compute descriptive statistics by diagnosis (that is, for each of the two groups in one table) using similar steps to those covered in Green and Salkind's Lesson 21 and in the Module/Week 3 presentation (HS GPA scores by Gender).
• b) Construct a boxplot to show the difference between the mean scores of the 2 groups
3a) Compute descriptive statistics by diagnosis (that is, for each of the two groups in one table)
3b) Construct a boxplot to show the difference between the mean scores of the 2 groups.
Part I: Questions 1-7 the following questions.
If applicable, remember to show work in your homework document for partial credit.
1) What are the 6 steps of hypothesis testing?
(State the 6 steps)
A)
B)
C)
D)
E)
F)
2) Using the z table in Appendix B, calculate the following percentages for a z score of -0.29
2-a) % above this z score:
2-b) % below this z score:
2-c) At least as extreme as this z score (on either side):
3) Rewrite each of the following percentages as probabilities, or p levels:
3-a) 5% =
3-b) 76% =
3-c) 59% =
4) If the critical values, or cutoffs, for a two-tailed z test are -2.17 and +2.17, determine whether you would reject or fail to reject the null hypothesis in each of the following cases:
4a) z = -0.87
4b) z = 2.19
5) Imagine a class of twenty-five 12-year-old girls with an average height of 62 inches. We know that the population mean and standard deviation for this age group of girls is m=59 inches, s = 2.5 inches. (Note that this is a z statistic problem.)
5a) Calculate the z statistic for this sample.
5b) How does this sample mean compare to the distribution of sample means? In other words, how does the height of the girls in the sample compare to the height of girls in the general population?
6) For the following scenarios, identify whether the researcher has expressed a directional or a nondirectional hypothesis:
6a) Cell phones have changed the levels of closeness in long-distance relationships.
6b) A professor wonders whether students who eat a healthy breakfast score better on exams in morning courses than those who do not eat a healthy breakfast.
7) For the following scenario, state the null and research hypotheses in both words and symbolic notation. Symbolic notation must include the symbols " " and " " and a comparison operator (=, ≠, <, >, ≤, ≥), as described in Nolan and Heinzen (2014). Remember to consider whether the hypothesis is nondirectional or directional.
Scenario: A professor wonders whether students who eat a healthy breakfast score better on exams in morning courses than those who do not eat a healthy breakfast.
Null Hypothesis (H0): Symbolic Notation
Null Hypothesis:
Written Statement
Research Hypothesis (H1): Symbolic Notation
Research Hypothesis:
Written Statement
Part I: Questions 8a-8g
Fill in the highlighted blanks with the best word or words.
8-a) Values of a test statistic beyond which you reject the null hypothesis are called ________.
8-b) The ________ is the area in the tails in which the null can be rejected.
8-c) The probability used to determine the critical values, or cutoffs, in hypothesis testing is known as a ________ level, also known as alpha.
8-d) If your data differ from what you would expect if chance were the only thing operating, you would call your finding ________.
8-e) A hypothesis test in which the research hypothesis is directional is a(n) ________ test.
8-f) A hypothesis test in which the research hypothesis specifies that there will be a difference but does not specify the direction of that difference is a(n) ________ test.
8-g) If your z-statistic exceeds the critical cutoff, you can ________ the null hypothesis.
Part I: Questions 10a-10c
The police department of a major city has found that the average height of their 1,050 officers is 70 inches (in.) with = 2.5 inches. Use the normal distribution and the formulas and steps in this week's presentations to the following questions:
Note: Showing work is required for this section. Remember that it helps to transfer the raw mean and SD from the description above to the standardized curve shown here (though you don't need to show this). This helps compare raw and z scores and check your work.
10a) What is the z score for an officer who is 72 inches tall? Based on the z score and the z table, what is the officer's percentile?
(z score): ):
(percentile): Work/reasoning using z table (required):
10b) What is the height (in inches) that marks the 75th percentile for this group of officers?
10c) What percent of officers are between 65 and 72 inches tall?
Part I: Questions 11a-11c
The verbal part of the Graduate Record Exam (GRE) has a of 500 and = 100. Use the normal distribution and the formulas and steps in this week's presentations to the following questions:
Note: Showing work is required for this section. Remember that it helps to transfer the raw mean and SD from the description above to the standardized curve shown here (though you don't need to show this). This helps compare raw and z scores and check your work.
11a) What is the z score for a GRE score of 597?
What is the percentile rank of this z score?
(z score): ):
(percentile): ):
11b) What GRE score corresponds to a percentile rank of 18%?
11c) If you wanted to select only students at or above the 87th percentile, what GRE score would you use as a cutoff score (i.e. what GRE score corresponds to this percentile)?
Part II: SPSS Analysis
For this section, you will be using last module/week's data set containing IQ scores.
Open the file; it should also contain the standardized IQ variable you created last module/week.
Part II:
Question 1a & 1b
Use last week's HW file that you created using IQ scores, and the SPSS reading and presentation from this week.
• Using the z-scored IQ variable, create percentile ranks assuming the scores are normally distributed.
o Call the new percentile variable "IQ rank."
1a) List the first 5 IQ ranks from your file (rows 1-5).
Row 1:
Row 2:
Row 3:
Row 4:
Row 5:
1b) Which raw IQ score seems to best divide the top 50% from the bottom 50% of scores?
(This score can be found by looking carefully over the values in the IQ rank column) (1 pt)
Part III: SPSS Data Entry and Analysis
There is no Part III material this module/week.
Part IV: Cumulative
Data provided below for respective questions.
Part IV: (Non-SPSS)
Questions 1-4
For a distribution with M = 35 and s = 7:
1) What is the z-score corresponding to a raw score of 21?
2) What is the z-score corresponding to a raw score of 39?
3) If a person has a z-score of 1.7, what is his/her raw score?
4) If a person has a z-score of -.62, what is his/her raw score?
Part IV: (Non-SPSS)
Question 5-8________________________________________
For the following types of data, state the graph that would be the best choice to display the data.
Two items have more than one correct -for these, either is acceptable.
5) A nominal independent variable (IV) and a scale dependent variable (DV)
6) One scale variable with frequencies (when you want to see the general shape of the distribution).
7) One scale IV and one scale DV
8) One nominal variable broken down into percentages