Reference no: EM131401298
Income and housing revisited. In given Exercise, we learned that the Office of Federal Housing Enterprise Oversight (OFHEO) collects data on various aspects of housing costs around the United States. Here's a scatterplot (by state) of the Housing Cost Index (HCI) versus the Median Family Income (MFI) for the 50 states. The correlation is r = 0.65. The mean HCI is 338.2, with a standard deviation of 116.55. The mean MFI is $46,234, with a standard deviation of $7072.47.
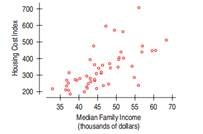
a) Is a regression analysis appropriate? Explain.
b) What is the equation that predicts Housing Cost Index from median family income?
c) For a state with what would be the predicted HCI?
d) Washington, DC, has an MFI of $44,993 and an HCI of 548.02. How far off is the prediction in b) from the actual HCI?
e) If we standardized both variables, what would be the regression equation that predicts standardized HCI from standardized MFI?
f) If we standardized both variables, what would be the regression equation that predicts standardized MFI from standardized HCI?
Exercise :
Income and housing. The Office of Federal Housing Enterprise Oversight (www.ofheo.gov) collects data on various aspects of housing costs around the United States. Here is a scatterplot of the Housing Cost Index versus the Median Family Income for each of the 50 states. The correlation is 0.65.
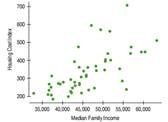
a) Describe the relationship between the Housing Cost Index and the Median Family Income by state.
b) If we standardized both variables, what would the correlation coefficient between the standardized variables be?
c) If we had measured Median Family Income in thousands of dollars instead of dollars, how would the correlation change?
d) Washington, DC, has a Housing Cost Index of 548 and a median income of about $45,000. If we were to include DC in the data set, how would that affect the correlation coefficient?
e) Do these data provide proof that by raising the median income in a state, the Housing Cost Index will rise as a result? Explain.
|
Write the equation of the regression line
: Write the equation of the regression line.- Estimate the Nicotine content of cigarettes with 4 milligrams of Tar.- Interpret the meaning of the slope of the regression line in this context.
|
|
Describe the communication mechanism
: Develop a 12 - 15 slide presentation that you will use for the kick-off meeting. In the presentation, identify the participants of the meeting, the objectives of the meeting, the meeting agenda, and the project's objectives. Use the remaining slid..
|
|
Demonstrated the characteristics of the developmental stage
: Write a 2- to 3-page essay that describes how the person or group in the second column demonstrated the characteristics of the developmental stage in the third column
|
|
What systems are required in order to facilitate data
: What systems are required in order to facilitate data capture, exchange of information, and analysis of the captured data? How will the company utilize managerial information systems to improve overall effectiveness and efficiency?
|
|
Correlation coefficient between standardized variables be
: Describe the relationship between the Housing Cost Index and the Median Family Income by state.- If we standardized both variables, what would the correlation coefficient between the standardized variables be?
|
|
Determine the critical pressure ratio
: Determine the critical pressure ratio, the gas velocity at the throat, the expansion area ratio, and the theoretical nozzle exit velocity.
|
|
Write your post from the perspective of your chosen composer
: Jazz served as the foundation for rock and roll music, which is what we will be exploring in this week's discussion. With this in mind, for this assignment, select one Jazz composer that is not covered in the course text.(Be sure to choose someone..
|
|
Design a test an association between exercise and anxiety
: You want to test the hypothesis that exercise is linked to lower anxiety. Design a study to test an association between exercise and anxiety. You should measure exercise and measure anxiety (do not propose an experiment). Describe your design
|
|
Significant benefits of pay for performance system
: Describe some of the most significant benefits of Pay for Performance System? Pay for Performance also has its list of challenges. Discuss the main areas of concern with the implementation of a Pay for Performance System.
|