Reference no: EM131243855
Question 1 -
Charity is a big business in the United States. The Web site charitynavigator.com gives information on roughly 5500 charitable organizations, and there are many smaller charities that fly below the navigator's radar screen. Some charities operate very efficiently, with fundraising administrative expenses that are only a small percentage of total expenses, whereas other spend a high percentage of what they take in on such activities. Here is data on fundraising expenses as a percentage of total expenditures for a random sample of 60 charities.
|
6.1
|
12.6
|
34.7
|
1.6
|
18.8
|
2.2
|
3
|
2.2
|
5.6
|
3.8
|
|
2.2
|
3.1
|
1.3
|
1.1
|
14.1
|
4
|
21
|
6.1
|
1.3
|
20.4
|
|
7.5
|
3.9
|
10.1
|
8.1
|
19.5
|
5.2
|
12
|
15.8
|
10.4
|
5.2
|
|
6.4
|
10.8
|
83.1
|
3.6
|
6.2
|
6.3
|
16.3
|
12.7
|
1.3
|
0.8
|
|
8.8
|
5.1
|
3.7
|
26.3
|
6
|
48
|
8.2
|
11.7
|
7.2
|
3.9
|
|
15.3
|
16.6
|
8.8
|
12
|
4.7
|
14.7
|
6.4
|
17
|
2.5
|
16.2
|
a) Draw a stem and leaf plot of this data using leaf unit =1.0, with 5 leaf categories per stem. Also find the increment.
b) Construct a frequency table and display it as a histogram using a class width of 10 starting at 0. [Recall: LCB is included in the class interval whereas UCB is not included.] (Be sure to show all of your work, including your frequency chart.)
c) What is the proportion of fundraising expenditures less than 10?
d) What is the proportion of fundraising expenditures between 10 and 60?
e) How would you describe the shape of the histogram? (right skewed, left skewed, normal or inconclusive)
Question 2 -
Based on extensive testing, it is determined by the manufacturer of a washing machine that the time x (in years) before a major repair is required is characterized by the probability density function
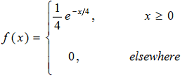
The machine is considered a bargain if it is unlikely to require major repair before the sixth year.
a) Find the probability that a major repair occurs after 6 years.
b) Find the probability that a major repair occurs in the first year.
c) Does the machine seem to be a bargain?
d) Find the median time before a major repair.
Note: For (a), (b) and (d), don't forget your concluding statements! For (c), you must give an explanation.
Question 3 -
Determine the following percentiles for the standard normal distribution (show all your work):
(a) 22nd
(b) 99.88th
Question 4 -
The article "Error Distribution in Navigation" suggests that the frequency distribution of positive errors (magnitudes of errors) is well approximated by the distribution f(x) = (0.1)e-0.2|x| for -∞ < x < ∞ , where x represents the lateral position error (nautical miles), which can be either positive or negative.
a) Plot the corresponding density curve in MAPLE. Also, verify that is a legitimate density function.
b) What proportion of errors are negative? At most 2?
Note: For part (a), I want you to plot the graph in maple, but I want you to verify the density function by hand. For part (b), don't forget the therefore statements!
Question 5 -
A process used in filling bottles with soft drink results in net weights that are normally distributed, with a mean of 2 liters and a standard deviation of 0.05 liter. Bottles filled to less than 95% of the listed net weight can make the manufacturer subject to penalty by the state office of consumer affairs; bottles filled above 2.10 liters may cause excess spillage upon opening.
a) What proportion of the bottles will contain
(1) Between 1.90 and 2.0 liters?
(2) At least 2.10 liters?
b) Ninety-nine percent of the bottles would be expected to contain at least how much soft drink?
c) The central 40% of bottles will lye between what two liters?
Note: Don't forget your concluding statements!
|
Code a console-based program in python
: CP1404/CP5632 2016 SP2/22/52 Assignment - Shopping List 1.0. You are to plan and then code a console-based program in Python 3, as described in the following information and sample output. This assignment will help you build skills using selection,..
|
|
Prepare a report on photostimulable phosphors
: Prepare a report on photostimulable phosphors - Includes (any things related to the topic) introduction, Body, Conclusion and References
|
|
Review underlying cause of biology and inherited behavior
: Review the underlying cause of biology and inherited behavior then suggest two (2) possible outcomes for each. Next, determine whether either of these underlying causes can be treated and corrected to allow an individual to align his or her thinki..
|
|
A person who thinks the public sector is too large
: A person who thinks the public sector is too large? How does the "ratchet effect" affect anti-inflationary fiscal policy?
|
|
Construct a frequency table and display it as a histogram
: Construct a frequency table and display it as a histogram using a class width of 10 starting at 0. [Recall: LCB is included in the class interval whereas UCB is not included.] (Be sure to show all of your work, including your frequency chart.)
|
|
Expresses your position on the value of wikipedia
: Compose an essay, between about 1,000 and 1,500 words, that expresses your position on the value of Wikipedia for college students.
|
|
Report on physical principles of digital imaging
: Prepare a report on physical principles of digital imaging fluoroscopic imaging system - Includes (any things related to the topic):introduction, Body, Conclusion and References
|
|
How is the market better today or worse
: Basically everything there is to know about real estae investing, pros cons risks benifits, diffrence between land and property investing. The diffrence between the housing bubble from 2008 and now, what is forclosere on homes, how is the market b..
|
|
What do you see as your strengths regarding working on team
: Based on your self-assessment, what do you see as your strengths and weaknesses regarding working on team? How does working effectively on a team give you an advantage in the workplace? How do groups normally develop?
|