Reference no: EM131407276
Description
In the previous assignment you had to mark a multiple-choice exam for 27 students. marks_assignment1.tsv contains the marks of the students.
a) Read the marks from the marks_assignment1.tsv into a data.frame called marks.
b) Write a function called getDegree, which takes as input a mark and returns the degree the student achieved:
- "1st" for marks higher or equal to 70
- "2:1" for marks higher or equal to 60 and lower than 70
- "2:2" for marks higher or equal to 50 and lower than 60
- "3rd" for marks higher or equal to 40 and lower than 50
- "failed" for marks lower than 40
Hint: One of the many ways to do this would be with if statements.
c) Compute the degree for each student and add a new column to the data.frame called degree.
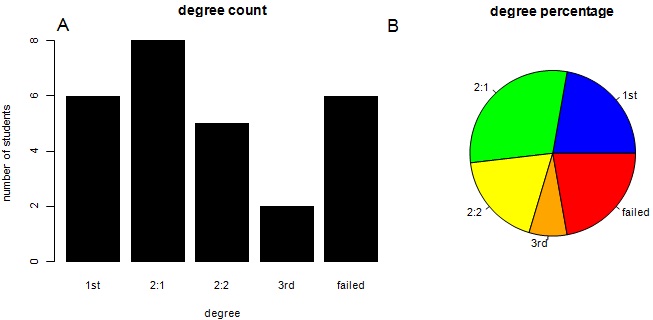
d) Create a plot and save it to a pdf file called degree_statistics.pdf. The plot comprises of two panels on one row. The first panel is a bar graph with the number of students that obtain each degree and the second panel is a pie chart of the same information. Add titles, labels, a letter to identify each panel ("A" and"B") in the top left corner of the panel (outside the plot). Change the colour of the bar plot to black. Used a different colour for each degree: blue for"1st", green for "2:1", yellow for "2:2" orange for "3rd" f and red for "failed"
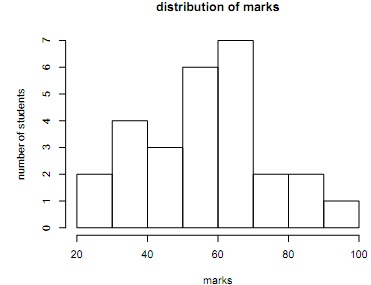
e) Create a histogram with all the marks and save it to a pdf file called marks_hist.pdf. Add titles and labels to the plot.
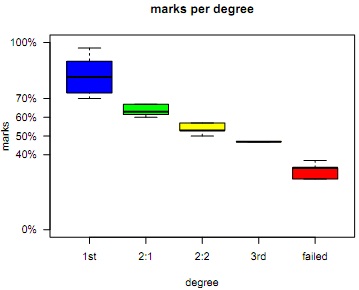
f) Split the marks based on the degree and create a box plot for the marks of each degree (you will have a box plot with 5 boxes, one for each of the degrees). Used a different colour for each degree (same as point d).
Change the y-axis to display horizontally only the levels: "0%", "40%", "50%", "60%", "70%" and "100%". Save this plot into a pdf file called marks_boxplot.pdf.
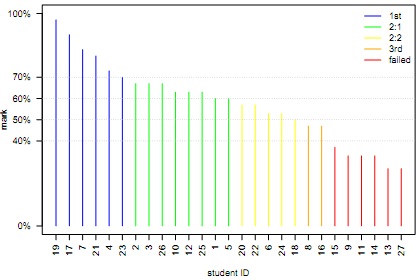
g) Order the data.frame based on the marks in decreasing order. Split the data.frame based on the degree. Plot using vertical bars the marks of every student that obtained a "first".
Hint: look at the type argument of the plot function.
Using a for loop and lines plot the rest of the marks grouped by degrees. Keep the same colour scheme from task d. Add a legend on the top right corner with the degrees and the colour schemes. Add titles and labels to the plot. On x-axis, plot the student id vertically. Add dotted gray lines delimiting the degrees. Change the y-axis as in task f. Save this plot to a pdf file marks_by_degree.pdf
Attachment:- marks_assignment1.rar
|
Organizational architecture point of view
: Enron was clearly a company riddled with fraud and excess; its conduct drove it into bankruptcy. The text argues that individual behavior was not at the core of Enron's problems. What were the problems with this corporation ?om an organizational ar..
|
|
How you will handle brady vs maryland
: Write a professional memorandum outlining and explaining how you will handle this situation. What recommendations would you make?
|
|
Define and discuss emotional intelligence and its dimensions
: You were recently asked to attend a meeting to discuss the hiring process in your workplace. The human resources director attended and made the following statement: "We obviously want intelligent people, but we also want them to have emotional in..
|
|
Infinite number of solutions
: a) Find the value of b so that the system has an infinite number of solutions. b) Find the value of b so that the system has a single solution.
|
|
Compute the degree for each student
: Compute the degree for each student and add a new column to the data.frame called degree and Split the marks based on the degree and create a box plot for the marks of each degree and Order the data.frame based on the marks in decreasing order. Split..
|
|
Make a flowchart of the manufacturing operations
: Make a flowchart of the manufacturing operations required to produce this device.
|
|
Calculate income before taxes
: After paying income taxes of 29%, Kenneth's annual take-home income was $39,050. Calculate his income before taxes. Round to the nearest cent.
|
|
Describe how we can balance the protection of the population
: SEC315- Explain why this situation is interpreted to be a USA PATRIOT Act case. Describe how we can balance the protection of the population with traditional civil rights in a free and open society.
|
|
Determine and interpret the p value for test
: From these sample results, and using the 0.10 level of significance, could the politician conclude that the percentage of young working women who are low-paid in her county might be the same as the percentage of young women who are low-paid in the..
|