Compute sample statistic

Assignment Help Basic Statistics
Reference no: EM1379384

A psychologist develops a new inventory to measure depression.  The population of "normal" individuals has mean score on this test of µ = 55 with σ = 12.  To determine whether the test is sensitive to detecting those individuals that are severely depressed, a random sample of patients who are described as depressed by a therapist is selected and given the test.  Presumably, the higher the score on the inventory, the more depressed the patient is.  The data are as follows: 59, 60, 60, 67, 65, 90, 89, 73, 74, 81, 71, 71, 83, 83, 88, 83, 84, 86, 85, 78, 79

Use Hypothesis testing to determine if the new inventory differentiates between the patients who are described as depressed?  Use an α = .05

Step 1: State Hypothesis

The Null hypothesis

H0: µdepression measure = 55

a. State the null hypothesis in your own words

The Alternative hypothesis

H1: µdepression measure  ≠ 55

b. State the alternative hypothesis in your own words

Step 2: Set Criteria

                α = .05 with a two tails

1768_Compute Sample Statistic.png

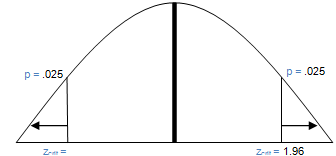
c. Using the table in the book fill in the values for p and z critical

Step 3: Compute Sample Statistic

In this example we are not given M or n.  We are however given the sample scores, so all we have to do to get M is to find the average of the scores.  We get n by counting the frequency of scores n =21.

M = (59 + 60 + 60 + 67 + 65 + 90 + 89 + 73 + 74 + 81 + 71 + 71 + 83 + 83 + 88 + 83 + 84 + 86 + 85 + 78 + 79)/ 21 = 1609/21 = 76.62

σM = σ/√n                            σM = 12/√21 = 12/4.58 = 2.62

z = (M - μ)/ σM  zobt = (76.62 - 55)/ 2.62 = 21.62/ 2.62 = 8.25

d. Use Excel to replicate the test statistic that was computed by hand.  Include the output or a copy of your excel file

Step 4: Make a decision

e. Did you reject the null/fail to reject the null

f. State your conclusions in your own words

2. A rocket scientist, Dr. Boom, is measuring the weight of a sample of 25 rockets in his latest spaceship.  He thinks they might weight less than the average rocket.  The sample has on average 102 lbs with a standard deviation of 10 lbs.  The average rocket weights 106 lbs. 

Use Hypothesis testing to determine if Dr. Boom is correct, that his sample of 25 rockets weight less than the average rocket.    Use an α = .01

Step 1: State Hypothesis

The Null hypothesis

H0: µrocket ≥ 106

a. State the null hypothesis in your own words

The Alternative hypothesis

H1: µrocket< 106

b. State the alternative hypothesis in your own words

Step 2: Set Criteria

α = .01 with a one tailed test

df = n - 1 = 25 - 1 = 24

683_Compute Sample Statistic1.png

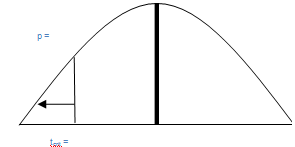
c. Using the table in the book fill in the values for p and t critical

Step 3: Compute Sample Statistic

d. In this example we are not given the raw data which means we cannot use Excel to compute the test statistic; however, we are given all the necessary values to compute the test statistic by hand.  Compute the test statistic.

Step 4: Make a decision

e. Did you reject the null/fail to reject the null

f.  State your conclusions in your own words

Reference no: EM1379384

Questions Cloud

Clock drift results in error : Think about a frame being sent using synchronous transmission. Suppose that samples are taken at the middle of the bit period and that the clocks are synchronized at the starting of each frame.
As part of your development as a new member of ikea''s retail : As part of your development as a new member of IKEA's Retail Division you have been exciting by Andres Moberg to with identifying key strategic issues facing the company
How would you classically condition an adventure : How would you classically condition an adventuresome 2-year-old to be more fearful of running across a busy street near her house.
How does cognitive functioning enhance diversity : Is perceptual learning necessary for correct interpretation of pictures? If so, which aspects of picture perception are most affected by learning also experience.
Compute sample statistic : Use Hypothesis testing to determine if Dr. Boom is correct, that his sample of 25 rockets weight less than the average rocket.
What is method by which researchers conduct research : There are three different methods to researching sociology: positivist, interpretive also critical. What is method by which researchers conduct research with personal neutrality also are value-free.
Explain what is net trade credit and how is it computed : Explain what is net trade credit? How is it computed? Why is it important? Explain what is a compensating balance? Why are they used? How can they be a advantage for the company borrowing money?
Single table manipulation and table join manipulation : Explain one drawbacks and benefits of Internet enabled technology use by firms to augment information flow both within and between company departments, partners, and consumers?
How did pavlov also watson focus on scientific inquiry : How did Pavlov also Watson focus on scientific inquiry of behaviours differ from earlier viewpoints of structural lists, psychoanalysts also functionalities.

Reviews

Write a Review

Basic Statistics Questions & Answers

  Illustrate value of the t test statistic if you are testing

Explain the value of test statistic using t distribution for the given value. Illustrate value of the t test statistic if you are testing a hypothesis.

  Values of probability on discrete distribution

A bookcase contains 3 statistics books and 4 biology books. If 2 books are chosen at random, find the chance that both are statistics books.

  Example on sampling variability

Sampling variability refers to the idea that different samples will include different individuals

  Simple random sampling process

Randomly select a sample of five rental agencies. Start with row two and column two. The number is 90935. Use the first two numbers starting with 90.

  Confidence interval for true population proportion

Calculate sample proportion and then also calculate a 99% confidence interval for true population proportion, p.

  Range and correlation coefficient

Find out the range of the following set of whole numbers: 12, 13, 15, 17, 12, 18, 12, 19, 13, 12, 14, 13, 12, 15

  Determining hypothesis statement and distribution

Write the hypothesis statement. What distribution are you using?

  Assumptions of t distribution and normal distribution

Assume the population is normally distributed, the confidence level is 95%, n = 12, and σ is unknown.

  Determining mutually exclusive information from abstract

Following is based on information from Statistical abstract of the United States, Dec, 1992. Are A and B mutually exclusive?

  Testing equality of two mean

Testing equality of two means - difference in performance of the two gasolines and difference in gasoline mileage output

  The bootstrap method of inference relies on

A permutation resample for a two-sample test

  Find out the constant using probability density function

Find out the constant using probability density function also cumulative distribution function. Assume X be a continuous random variable with probability density function.

Free Assignment Quote

Assured A++ Grade

Get guaranteed satisfaction & time on delivery in every assignment order you paid with us! We ensure premium quality solution document along with free turntin report!

All rights reserved! Copyrights ©2019-2020 ExpertsMind IT Educational Pvt Ltd