Compute all relevant summary statistics

Assignment Help Applied Statistics
Reference no: EM1383841

You are expected to complete a project related to inferential statistics. The project must contain the following components

a. Title of the project
b. Introduction and Objectives
c. Data collection: Data should be a real a data set (you may find the data in the internet, published papers but please provide the source).
d. Display the data graphically (if you wish)
e. Compute all relevant summary statistics.
f. Perform the inferential statistics (Interval estimation, Hypothesis testing etc.)
g. Conclusions
h. References

Many customers at a certain grocery store have been complaining about the amount of time they wait in line at the checkout stand (Albright 144). So the manager decides to offer a coupon to anyone who waits longer than a certain amount of minutes, say, 2.5 minutes. Before starting the program, she wants to find the probability that a randomly selected customer will receive a coupon. If the random variable X denotes the time spent waiting in line, then the manager wants to know P(X > 2.5). She hypothesizes that because exponential distribution is used to describe the wait time between events, then X should be exponential. As said in Essentials of Mathematical Statistics, a random variable X has an exponential distribution if its probability density function is

1182_Complete a project related to inferential statistics.png

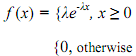
where λ = 1/β > 0, and when its cumulative distribution function is

2250_Complete a project related to inferential statistics1.png

So, we must complete the following objectives:

1) Show that the random variable X is exponential.
2) Compute the probability of the wait time when it is greater than 2.5 [P(X > 2.5)].
3) Find the relevant summary statistics.
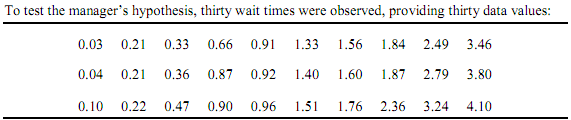
The Data Set

2276_Complete a project related to inferential statistics2.png

The Distribution

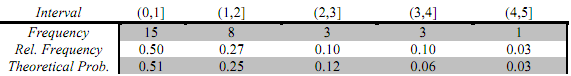
The chart below shows the frequency of the data set values on each interval, as well as the relative frequency. When the relative frequency is represented in a histogram, the histogram resembles the shape of a graph of an exponential pdf.

1907_Complete a project related to inferential statistics3.png

714_Complete a project related to inferential statistics4.png

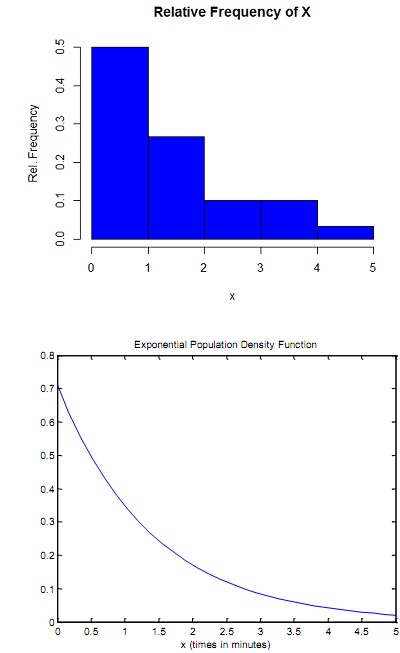
As shown above, both figures are practically alike. To further verify the hypothesis, the mean of X (the average wait time) is found to be 1.41 minutes. This means the parameter λ (1/mean) is approximately 0.71.

So if X is exponential with λ = 0.71, then, for instance,

1034_Complete a project related to inferential statistics5.png

This means that if X is indeed exponential with λ = 0.71, then about 51% of observed values of X will be between 0 and 1 minute. Note how the relative frequencies and theoretical probabilities are very close in each case. This leads us to conclude that the hypothesis of X being exponential with parameter λ = 0.71 is reasonable.

Thus the probability that a randomly selected customer will receive a coupon is

2453_Complete a project related to inferential statistics6.png

Summary Statistics

Conclusion

All-in-all, it can be proven that a random variable does have an exponential distribution from its data set. Note how the expected value, standard deviation, and mean are the same value. That is another property of exponential distribution, which is more evidence towards that distribution.

Verified Expert

Reference no: EM1383841

Questions Cloud

Compressibility of the aquifer porous media : What percent (fraction) of the storativity is contributed by the compressibility of the aquifer porous media?
Consider the state of politics today : Consider the state of politics today. Critically discuss why you think that the advent of television has enhanced or hurt society's ability to impact political leaders.
Preserve genetic variability within the population : Determine which of the three types of Natural Selection works to PRESERVE genetic variability within the population?
Solve the problem graphically for the amounts of each : Write the equations representing this information. b. Solve the problem graphically for the amounts of each food that should be used.
Compute all relevant summary statistics : You are expected to complete a project related to inferential statistics - show that the random variable X is exponential and compute the probability of the wait time when it is greater
Comparing the us-germany and japan : Develop a 250-300 word post addressing the following question. Comparing the U.S., Germany, and Japan, what is the right amount of "welfare" a country should have?
Suggest network design to support requirements of company : Suggest network design to support requirements of Silfinate Company following this move. Give your colleagues with feedback on their designs.
Research the chemical formula of equal and splenda : Discuss how do the results of this experiment relate to the role yeast plays in baking? What would you expect to see if the yeasts' metabolism was slowed down?
Leadership-member exchange theory : The Chapter discusses a number of different leadership theorists. Like - Path-Goal Leadership Theory, Leadership-Member Exchange Theory

Reviews

Write a Review

Applied Statistics Questions & Answers

  Develop a pareto chart

Develop a Pareto chart to identify the more significant types of rejection.

  Prepare a research on applied statistics

Perspective about the problem you are trying to analyze; in other words, you should review the literature concerning your subject. The library or the web will be a good source of information.

  Perform a hypothesis testing

The company wants to perform a hypothesis testing. Which of the following are the right hypotheses and what is the α-risk associated with the x' chart?

  Calculate the maximum reduction in the standard deviation

Calculate the maximum reduction in the standard deviation

  Perform the hypothesis test

What are the assumptions made in performing the hypothesis test in Question 3? Are these assumptions reasonable? Provide explanation to substantiate your view.

  Write your own newspaper article

Write your own newspaper article for the study with at least one appropriate table or graph.

  Hypothesis testing

What assumptions about the number of pedestrians passing the location in an hour are necessary for your hypothesis test to be valid?

  Evaluate the probability the sample mean

What can we say about the shape of the distribution of the sample mean?

  Sensitivity of mammography

Determine and interpret the sensitivity of mammography.

  Importance of the independent variable in linear regression

Discuss the importance of the independent variable in Linear Regression.

  Determine the correlation coefficient

Determine the correlation coefficient. Find the predicted value of Y given X = 75. Give an interpretation of the predicted value in the context of the problem.

  Data analysis and statistical modeling for business

Data Analysis and Statistical Modeling for Business

Free Assignment Quote

Assured A++ Grade

Get guaranteed satisfaction & time on delivery in every assignment order you paid with us! We ensure premium quality solution document along with free turntin report!

All rights reserved! Copyrights ©2019-2020 ExpertsMind IT Educational Pvt Ltd