Reference no: EM131223307
Regression Exercises Assignment
Part 1 (We will Start this in class.)
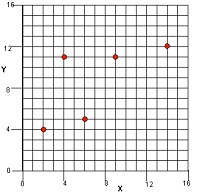
Suppose that theory predicts that Y is related to X by a linear function of the form: Y = m X + b, but random experimental error has been making it difficult to prove conclusively.
1. Hypothesize a straight line of the form Y* = mX + b which best "fits" this data and draw it representatively on the graph below.
2. Develop an expression for the difference or "error" between the actual data points and the value of the equation Y* = m X + b (i.e., the straight line) at the same value of X. Something of the form: error = (Y-Y*) where Y is the actual value paired with the corresponding value of X in the given data and Y* is the computed value from the equation. Represent Y* by (m X + b) in your algebra
3. Square the error expression for each data point. (Again, the error is the difference between the data point and the line, vertically.) (i.e., [Y-(m X +b)]2 ). You must expand this expression algebraically for each of the 5 points in your data set.
Example: for the first point (2,4) you must write and expand [4-(m*2 + b)]2. Square the expression as you did in High School algebra, multiplying each term by each of the others and gathering like terms.
4. Algebraically sum the squares of the difference expression representing the errors for all five points. After you squared all 5 expressions add them up and gather like terms.
5. Differentiate the summation equation with respect to slope, m, and intercept, b.
6. Set both equations equal to zero.
7. Solve simultaneously for m and b. (circle and label these important answers)
8. If you understand what you have done, congratulations, you understand a little bit about curve fitting, statistical modeling, regression analysis and can proudly say so to anyone who asks.
9. If you have developed clear, lucid, mathematical expressions and progressions using appropriate subscripts and function symbols (like the summation sign) you will get a handsome bonus for your efforts.
Part 2
Using the fundamental equations for the slope and intercept found in your book (and in many other places as well) re-compute the slope and intercept for the data from Part 1.
Part 3
Using the same data provided in Part 1 complete a simple linear regression in your calculator and report and define the critical values that your calculator provides when it completes a linear regression.
Part 4
Visit one or both of the following web sites. Enter the Part 1 data, get the regression parameters and play a little to see how additional data points change the equation and critical parameters. Print a screen shot to show your efforts.
https://www.shodor.org/interactivate/activities/Regression/
https://www.math.csusb.edu/faculty/stanton/m262/regress/
Part 5
Find another online application (or one for a smartphone) that can perform simple linear regression. List the source (website, name, version, etc.). Enter the Part 1 data, get the regression parameters and play a little to see how additional data points change the equation and critical parameters. Print a screen shot (or photo) to show your efforts.
Of course you should get the same answers each way you do the regression.
|
Last forms of entertainment to go digital
: Broadcast radio is one of the last forms of entertainment to go digital. Find the latest material describing the current state of digital broadcast radio, and write a two or three page paper in APA format that includes the type of multiplexing en..
|
|
Which change would shift the aggregate demand curve
: The economy has been sluggish, so in an effort to increase output in the short run, government officials have decided to cut taxes. - Which change would shift the aggregate demand curve further to the right?
|
|
Database and will sometimes impose a fine
: Sometimes books are lost or are returned in damaged condition. The manager must then remove them from the database and will sometimes impose a fine on the borrower.
|
|
Analyze how technology is used for innovation
: Analyze major technological innovations from the last five (5) years to determine the most significant innovation for entrepreneurs. Provide specific examples of how this new technology has encouraged new business creation or growth.
|
|
Complete a simple linear regression in your calculator
: Using the same data provided in Part 1 complete a simple linear regression in your calculator and report and define the critical values that your calculator provides when it completes a linear regression.
|
|
Component of the creating a scene view
: Clipping algorithms are an important component of the creating a scene view. Explain why clipping is necessary. Choose an example of a boundary and a line and show how the endpoints of the clipped line can be calculated.
|
|
Innovations in financial markets and output volatility
: After examining given Figure, explain the potential link between innovations in financial markets and output volatility since the 1980s.
|
|
Examine how soa helps make reuse more economical
: Discuss the most optimized sequence of services to deploy in an SOA roadmap, given metrics, revenue, and cost projections. Examine how SOA helps make reuse more economical.
|
|
Deploying microsoft direct access
: Write an email to your boss discussing the pros (or cons) of deploying Microsoft's DirectAccess instead of keeping the legacy VPN solution. Explain what you'll need to get the solution in place and what benefits it'll provide to the remote staff.
|