Calculate trial control limits for the two charts

Assignment Help Basic Statistics
Reference no: EM13241643

1. Samples of size n = 5 are collected from a process every half hour. After 50 samples have been collected, we calculate x'' = 20.0 and
s' = 1.5. Assume that both charts exhibit control and that the quality characteristic is normally distributed.

a) Estimate the process standard deviation.
b) Find the control limits on the x' and s charts.

c) If the process mean shifts to 22, what is the probability of concluding that the process is still in control?

2. Samples of n = 5 units are taken from a process every hour. The x'and R values for a particular quality characteristic are determined. After 25 samples have been collected, we calculate x'= 20 and R= 4.56.

a) What are the three-sigma control limits for x' and R?

b) Both charts exhibit control. Estimate the process standard deviation.

c) Assume that the process output is normally distributed. If the specifications are 19 ± 5, what are your conclusions regarding the process capability?

d) If the process mean shifts to 24, what is the probability of not detecting this shift on the first subsequent sample?

3. Thirty samples each of size 7 have been collected to establish control over a process. The following data were collected:

175_Estimate the process standard deviation.png

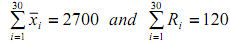
a) Calculate trial control limits for the two charts.

b) On the assumption that the R chart is in control, estimate the process standard deviation.

c) Suppose an s chart were desired what would be the appropriate control limits and center line?

4) Control charts for x' and R are in use with the following parameters. The sample size is n = 9. Both charts exhibit control. The quality characteristic is normally distributed.

2464_Estimate the process standard deviation1.png

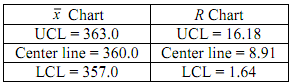
a) What is the α-risk associated with the x' chart?

b) Specifications on this quality characteristic are 358 ± 6. What are your conclusions regarding the ability of the process to produce items within specifications?

c) Suppose the mean shifts to 357. What is the probability that the shift will not be detected on the first sample following the shift?

d) What would be the appropriate control limits for the x' chart if the type I error probability were to be 0.01?

Reference no: EM13241643

Questions Cloud

Compute the concentration of h3po4 : Calculate the concentration of H3PO4 if 25.00 mL of the acid is titrated with 38.77 mL of 1.723 M KOH to produce K3PO4 and water.
Explain whaty is coefficient of variation for both projects : To evaluate the two projects, you decide to use the company's weighted average cost of capital (WACC) for the less risky project (12 percent) and the WACC plus two points (14 percent) for the more risky project.
With 95% confidence what do you conclude : You are interested in whether men participate more than women in political activities, so you survey 632 men and 675 women and ask them how many political events they attended within the past year. Here are your results.
Explain what is the energy per mole of photons emitted : An Argon ion laser emits a beautiful green beam with a wavelength of 514.7 nm. What is the energy per mole of photons emitted
Calculate trial control limits for the two charts : Calculate trial control limits for the two charts and on the assumption that the R chart is in control, estimate the process standard deviation.
Pricing strategy and pricing management : Pricing Strategy and Pricing Management
How will combined tax-transfer policy affect the demand : Suppose the government decides to increase taxes by $30 billion in order to increase Social Security benefits by the same amount. How will this combined tax-transfer policy affect aggregate demand at current prices
What is the z-score that corresponds to the 20th percentile : What is the value of z score required for a 70% confidence interval?
Compute the equilibrium partial pressures of the reactants : Calculate the equilibrium partial pressures of the reactants and products if the initial pressures are Ppcl5 = .5400 atm and Ppcl3 =.430 atm

Reviews

Write a Review

Basic Statistics Questions & Answers

  Fixing null and alternate hypotheses for single proportion

In terms of  p , the researcher should test which of the following null and alternative hypotheses?

  Probability that sample will have seven non-defective parts

A production process produces 90% non-defective parts. A sample of 10 parts from the production process is selected. What is the probability that the sample will contain 7 non-defective parts?

  Hypothesis testing-insurance data set

An auditor reviewed 25 oral surgery insurance claims from a particular surgical office, determining that the mean out-of-pocket patient billing above the reimbursed amount was $275.66 with a standard deviation of $78.11.

  Question-chi square test for independence

A recent study by a large retailer designed to determine whether there was a relationship between the importance a store manager placed on advertising and the size of the store revealed the following sample information:

  Preparing a report to present to the public health

You are preparing a report to present to the Public Health Council on the declining rates of gonorrhea in your state in both men and women over the last 10 years.

  Starbucks in the bauer college of business

The Starbucks in the Bauer College of Business found that 24% of customers purchase more than one cup of coffee per day from their shop. If 180 customers are randomly selected one day, what is the probability that no less than 25% of them purchase..

  Test the mean cholesterol content in egg

Test the mean cholesterol content in the egg is greater than 2.5 percent

  Difference in mean sbp among treatments

The data is shown on the table. Is there a difference in mean SBP between treatments? Run the appropriate test at α= 0.05

  Find probabilities that in one hour there are many calls

Find the probabilities that in 1 hour (a) there are between 23 and 26 calls inclusive, (b) more than 30 calls, using the normal approximation to the poisson distribution.

  True average repair time

Is there sufficient evidence for concluding that true average repair time exceeds 200 min? Carry out a test of hypotheses using a significance level of .05.

  Find the probability of getting all girls

Find the probability of getting all girls. Find the probability of getting at least one child of each sex. Find the probability of getting exactly two children of each sex.

  Computing security risk

Security B has an expected return of 12 percent, a standard deviation of returns of 10 percent, a correlation with the market of 0.7 and a beta coefficient of 1.0.

Free Assignment Quote

Assured A++ Grade

Get guaranteed satisfaction & time on delivery in every assignment order you paid with us! We ensure premium quality solution document along with free turntin report!

All rights reserved! Copyrights ©2019-2020 ExpertsMind IT Educational Pvt Ltd