Reference no: EM131885598
Questions - Total 40 questions, don't need to show work. Basic Stat.
Question 1 - Please use sample data provided in the following table in order to answer questions on this assignment. Round answers to three places after the decimal point. After you enter data into the computer verify that there was no data entry error by computing the sample mean and sample standard deviation of each variable in your worksheet. These should be identical to statistics provided in the last two rows of the data table.
|
Person_ID
|
X
|
Y
|
Z1
|
Z2
|
Group
|
|
1
|
9
|
10
|
157.90
|
163.90
|
Manager
|
|
2
|
3
|
6
|
156.64
|
148.64
|
Manager
|
|
3
|
2
|
7
|
160.45
|
155.45
|
Manager
|
|
4
|
8
|
8
|
153.13
|
160.13
|
Manager
|
|
5
|
2
|
7
|
170.14
|
168.14
|
Manager
|
|
6
|
8
|
4
|
150.09
|
149.09
|
Supervisor
|
|
7
|
10
|
5
|
163.74
|
161.74
|
Supervisor
|
|
8
|
4
|
3
|
134.47
|
142.47
|
Supervisor
|
|
9
|
1
|
6
|
174.17
|
177.17
|
Supervisor
|
|
10
|
6
|
9
|
150.05
|
151.05
|
Supervisor
|
|
11
|
5
|
10
|
141.47
|
148.47
|
Employee
|
|
12
|
3
|
5
|
156.59
|
148.59
|
Employee
|
|
13
|
5
|
4
|
161.88
|
162.88
|
Employee
|
|
14
|
4
|
3
|
150.99
|
158.99
|
Employee
|
|
15
|
8
|
1
|
174.95
|
174.95
|
Employee
|
|
16
|
5
|
1
|
166.90
|
165.90
|
Employee
|
|
17
|
8
|
10
|
128.43
|
124.43
|
Employee
|
|
18
|
1
|
7
|
169.11
|
168.11
|
Employee
|
|
19
|
1
|
2
|
153.73
|
150.73
|
Employee
|
|
20
|
5
|
4
|
151.45
|
146.45
|
Employee
|
|
21
|
3
|
2
|
172.85
|
164.85
|
Employee
|
|
22
|
8
|
5
|
146.05
|
137.05
|
Employee
|
|
23
|
9
|
8
|
171.48
|
178.48
|
Employee
|
|
24
|
7
|
4
|
153.55
|
151.55
|
Employee
|
|
25
|
5
|
1
|
166.52
|
164.52
|
Employee
|
|
Arithmetic mean
|
5.200
|
5.280
|
157.469
|
156.949
|
|
|
Standard Deviation
|
2.784
|
2.880
|
12.159
|
12.776
|
|
The sum of all Z2 values is _____.
157.469
3936.730
3396.730
3923.730
Question 2 - [Use data from question 1] The mean value of Z1 for all individuals designated as managers in the sample is _____.
2365.950
159.652
13.096
157.469
Question 3 - [Use data from question 1] Median value of Z1 for all individuals in the sample is _____.
156.640
158.990
156.949
158.909
Question 4 - [Use data from question 1] The Pearson coefficient of correlation between Z1 and Z2 for the group of managers in the sample is _____.
9.010
0.557
0.575
0.910
Question 5 - [Use data from question 1] If we subtract the mean value of Y for managers from the mean value of Y for supervisors, then the answer is _____.
-2.200
1.000
2.200
0.220
Question 6 - [Use data from question 1] Construct a new variable J such that J = 1 + 2*X. Mean and standard deviation of J are _____ and _____ respectively.
7.200, 2.784
5.568, 11.400
11.400, 5.568
2.784, 7.200
Question 7 - [Use data from question 1] Assume that a new (26th) value of X becomes available. As a result the arithmetic mean of all 26 X values decreases to 5. The new X value must be _____.
10
5
0
5.2
Question 8 - [Use data from question 1] Transform X into a new variable X' by adding 5 to each vaue of X, and transform Y into a new variable Y' by multiplying each value of Y with 2. The correlation between X' and Y' equals the correlation between _____ and _____.
X, Y'
X', Y
X, Y
All of the above
None of the above
Question 9 - [Use data from question 1] The coefficient of variation of Y is _____ times _____ than the the coefficient of variation of X.
1.019, larger
0.982, larger
101.879, larger
1.019, smaller
Question 10 - [Use data from question 1] ∑(X-X-) =
186
124.8
0
None of the above
Question 11 - [Use data from question1] ∑(X-X-)2 =
15,575.040
186
0
None of the above
Question 12 - [Use data from question 1] The variance of Y is:
2.880
8.293
0
1.697
Question 13 - [Use data from question 1] The Range for all Z2 values is:
54.05
46.52
-46.52
-54.05
Question 14 - [Use data from question 1] If X is the independent variable and Y is the dependent variable, then the correct scatter plot showing the relationship between these two variables is:
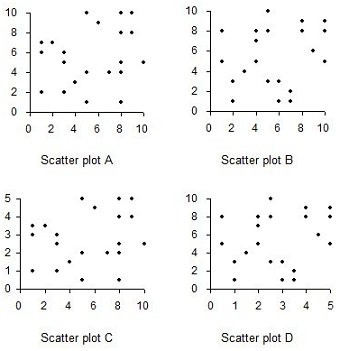
Scatter plot A
Scatter plot B
Scatter plot C
Scatter plot D
Question 15 - [Use data from question 1] An appropriate graph for variable Z1 is:
Pie chart
Bar chart
Histogram
Scatter plot
Question 16 - [Use data from question 1] An appropriate graph for variable Group is:
Histogram
Bar chart
Stem and leaf plot
Scatter plot
Question 17 - [Use data from question 1] Group is a __________ variable.
Ratio
Interval
Categorical
Quantitative
Question 18 - [Use data from question 1] Variable X is:
Discrete
Continuous
Question 19 - [Use data from question 1] If a person is selected at random from the sample, what is the probability (expressed as a percentage) that this person is a supervisor?
20%
0.20%
40%
None of the above
Question 20 - [Use data from question 1] If a person is selected at random from the sample, what is the probability (expressed as a percentage) that this person is either a manager or a supervisor?
20%
0
40%
None of the above
Question 21 - [Use data from question 1] If a person is selected at random from the sample, what is the probability (expressed as a percentage) that this person is neither a manager nor a supervisor?
20%
0
40%
None of the above
Question 22 - [Use data from question 1] If a person is selected at random from the sample, what is the probability (expressed as a percentage) that this person is both a manager and a supervisor?
0
40%
20%
None of the above
Question 23 - [Use data from question 1] A person is selected at random from the sample. Given that this person is an employee what is the probability that the Y value for this person equals 10.
0
0.120
0.133
None of the above
Question 24 - [Use data from question 1] A person is selected at random from the sample. Given that this person has a Y value equal to 10, what is the probability that this person is an employee?
0.667
0.333
0.133
None of the above
Question 25 - [Use data from question 1] If a person is selected at random from the sample, what is the probability (expressed as a percentage) that for this person the sum of X and Y exceeds 10?
60%
20%
40%
80%
Question 26 - [Use data from question 1] A person is selected at random from the sample. Given that this person has an X+Y value greater than 10, what is the probability that this person is a manager?
0.50
0.20
0.08
0.30
Question 27 - [Use data from question 1] For what proportion of the sample the sum of X and Y exactly equals 10?
0.16
4
0
16
Question 28 - [Use data from question 1] For the last person in the sample [Person_ID = 25] calculate the z score for X using sample mean and sample standard deviation. This z score is:
-0.200
-0.072
0.072
None of the above
Question 29 - [Use data from question 1] Define a new column U such that U = X - Y. The sum of all U values is:
-2
0
1
2
Question 30 - [Use data from question 1] Create three new columns (T1, T2, and T) as follows. T1 should have a value of 1 for all persons with a Z1 value greater than 150, and a value of 0 for all persons with a Z1 value less than or equal to 150. T2 should have a value of 1 for all persons with a Z2 value greater than 150, and a value of 0 for all persons with a Z2 value less than or equal to 150. T = T1 + T2. The mean of all T values is:
38
1.25
1.52
None of the above
Question 31 - For the remaining questions use the data provided in the following table where X1 and X2 are before and after scores on a standardized test for 20 students. Use 5% level of significance for all tests unless instructed otherwise.
|
Student ID
|
X1
|
X2
|
Gender
|
|
1
|
10
|
12
|
Male
|
|
2
|
57
|
38
|
Male
|
|
3
|
65
|
57
|
Male
|
|
4
|
23
|
8
|
Male
|
|
5
|
30
|
21
|
Male
|
|
6
|
25
|
25
|
Male
|
|
7
|
19
|
30
|
Male
|
|
8
|
70
|
73
|
Male
|
|
9
|
5
|
1
|
Male
|
|
10
|
38
|
63
|
Male
|
|
11
|
71
|
85
|
Female
|
|
12
|
56
|
73
|
Female
|
|
13
|
47
|
29
|
Female
|
|
14
|
33
|
45
|
Female
|
|
15
|
58
|
67
|
Female
|
|
16
|
27
|
36
|
Female
|
|
17
|
75
|
82
|
Female
|
|
18
|
45
|
28
|
Female
|
|
19
|
68
|
64
|
Female
|
|
20
|
59
|
62
|
Female
|
Perform a one sample t test in order to evaluate whether or not the average X1 value equals 70 in the population. The degress of freedom for this test are:
40
19
20
18
Question 32 - Perform a one sample t test in order to evaluate whether or not the average X1 value equals 70 in the population. The hypoyhesized value of population mean in this test is:
5.37
70
Less than 0.001
2.09
Question 33 - Perform a one sample t test in order to evaluate whether or not the average X1 value equals 70 in the population. The p value for this test is:
2.09
5.37
70
Less than 0.001
Question 34 - Perform a one sample t test in order to evaluate whether or not the average X1 value equals 70 in the population. The conclusion for this test is:
Fail to reject the null hypothesis
Reject the null hypothesis
Accept both the null and alternative hypotheses
Reject both the null and alternative hypotheses
Question 35 - Perform a paired samples t test in order to evaluate whether or not the mean value of X1 equals the mean value of X2 in the population. The degrees of freedom for this test equal:
18
20
19
40
Question 36 - Perform a paired samples t test in order to evaluate whether or not the mean value of X1 equals the mean value of X2 in the population. The conclusion for this test is:
Fail to reject the null hypothesis
Reject the null hypothesis
Accept both the null and alternative hypotheses
Reject both the null and alternative hypotheses
Question 37 - Perform an independent samples t test in order to evaluate whether the average X1 score of male students equals the average X1 score of female students in the population. The degrees of freedom for this test equal:
38
20
18
19
Question 38 - Perform an independent samples t test in order to evaluate whether the average X1 score of male students equals the average X1 score of female students in the population. The conclusion for this test is:
Reject both the null and alternative hypotheses
Accept both the null and alternative hypotheses
Fail to reject the null hypothesis
Reject the null hypothesis
Question 39 - Convert variable "Gender" into a new binary variable "Gender_recoded" that takes a value of 0 for males and 1 for females. Next, run a multiple regresison model predicting X2 from X1 and Gender_recoded. The multiple regression results suggest that the following is(are) statistically significant predictor(s) of X2:
Gender_recoded only
X1 only
Neither X1 nor Gender_recoded
X1, Gender_recoded
Question 40 - The total amount of variability in X2 that can be explained by the multiple regression model is:
74.3%
12.97%
87.7%
0.74%