Reference no: EM132604104
Question 1. Assume that an individual consumes two goods X and Y. The total utility (assumed measurable) of each good is independent of the rate of consumption of other goods. The prices of X and Y are, respectively, $5 and $10.
|
Units of the Good
|
Total Utility of X
|
Total Utility of Y
|
|
1
2
3
4
5
6
7
8
|
50
95
135
170
200
225
245
260
|
400
750
950
1100
1220
1320
1400
1450
|
If the consumer has $110 to spend on X and Y, determine the utility-maximizing bundle X and Y.
Question 2. The utility function for an individual consumer is U = √100XY = 10X1/2Y1/2. The price of X is $2.5 and the price of Y is $5. His budget for these two goods is $200 per unit of time. Determine the bundle of X and Y that will maximize his total utility. Calculate the level of utility at the consumption optimum.
Question 3. The following linear demand specification is estimated for Conlan Enterprises, a price-setting firm:
Q = a + bP + cM + dPR
where Q is the quantity demanded of the product Conlan Enterprises sells, P is the price of that product, M is income, and is the price of a related product. The results of the estimation are presented below:
|
DEPENDENT VARIABLE:
|
Q
|
R-SQUARE
|
F-RATIO
|
P-VALUE ON F
|
|
OBSERVATIONS:
|
32
|
0.7984
|
36.14
|
0.0001
|
|
VARIABLE
|
|
PARAMETER
ESTIMATE
|
STANDARD
ERROR
|
T-RATIO
|
P-VALUE
|
|
INTERCEPT
|
|
846.30
|
76.70
|
11.03
|
0.0001
|
|
P
|
|
-8.60
|
2.60
|
-3.31
|
0.0026
|
|
M
|
|
0.0184
|
0.0048
|
3.83
|
0.0007
|
|
PR
|
|
-4.3075
|
1.230
|
-3.50
|
0.0016
|
a At the 1% level of significance, determine if the coefficients of price, income and the price of the related good is statistically significant.
b. At the 1% level of significance, determine if the regression equation as a whole is statistically significant.
c. What is the value of R-square and what does it tell us?
d. Given that the income is $10,000, the price of the related good is $40, and Conlan chooses to set the price of this product at $30, how many units Conlan can expect to sell?
e. At the price of X, price of R, and income given above, what is the point price elasticity of demand?
f. At the price of X, price of R, and income given above, what is the point income elasticity of demand?
Question 4. A consulting firm estimates the following quarterly sales forecasting model:
Qt = a + b + cD
The equation is estimated using quarterly data from 2007IV-2018II (t = 1,..., 43). The variable D is a dummy variable for the second quarter where:
D = 1 in the second quarter, and 0 otherwise.
The results of the estimation are:
|
DEPENDENT VARIABLE:
|
QT
|
R-SQUARE
|
F-RATIO
|
P-VALUE ON F
|
|
OBSERVATIONS:
|
43
|
0.8644
|
127.5
|
0.0001
|
|
VARIABLE
|
|
PARAMETER
ESTIMATE
|
STANDARD
ERROR
|
T-RATIO
|
P-VALUE
|
|
INTERCEPT
|
|
22.5
|
9.32
|
2.41
|
0.0201
|
|
T
|
|
1.86
|
0.55
|
3.38
|
0.0016
|
|
D
|
|
2.0
|
0.71
|
2.82
|
0.0075
|
a. At the 1 percent level of significance, is the coefficient of trend statistically significant? Why?
b. At the 1 percent level of significance, is the coefficient of dummy variable is statistically significant? Why?
c. What is the estimated intercept of the trend line in the second quarter?
d. What is the estimated intercept of the trend line in the third quarter?
e. Using the estimated trend line, what is the predicted level of sales in 2018IV ?
Question 5. Assume that labor - the only variable input of a firm - has the average and marginal product curves shown in the following figure. The price of labor is $5 per unit.
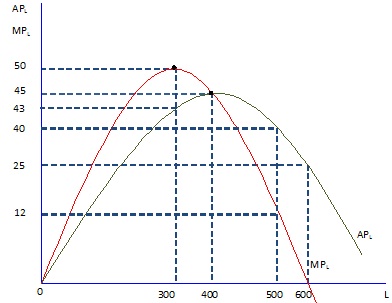
At minimum average variable cost, the firm employs _______ units of labor.
Minimum average variable cost is reached at ______________ units of output.
At its minimum value, average variable cost is $ ___________.
Marginal cost reaches its minimum value at 300units of labor usage, which corresponds to ___________ units of output.
At its minimum value, marginal cost is $ ___________.
The average variable cost when 500 units of labor are employed is $___________.
Question 6. Consider the following Cobb-Douglas production function Q=L1/2 K1/2
Suppose the firm wishes to produce 500 units of output. Given that the prices of labor and capital are $25 and $100, respectively, determine the optimal combination of labor and capital that would minimize the total cost. What is the total cost at the optimal input combination?
Question 7. The figure below shows a portion of the expansion path for a firm. The price of labor is $75.
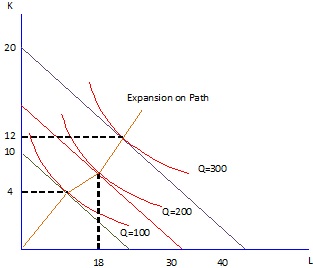
The price of capital is __________.
To produce 100 units efficiently, a manager would use _______________ units of labor and ______ units of capital. The minimum cost of producing 100 units is $__________.
To produce 200 units efficiently, a manager would use _______ units of labor and ______units of capital. The minimum cost of producing 200 units is ________.
To produce 300 units efficiently, a manager would use ________________________ units of labor and ________ units of capital. The minimum cost of producing 300 is __________.