Reference no: EM132340494
Goodness-of-Fit Test Assignment – Sec 10.1
1. According to the manufacturer of M&Ms, 12% of the peanut M&Ms in a bag should be brown, 15% yellow, 12% red, 23% blue, 23% orange, and 15% green. A student randomly selected a bag of peanut M&Ms. He counted the number of M&Ms that were each color and obtained the results shown below. We will test whether peanut M&Ms follow the distribution stated by M&M/Mars.
(a) First, complete the null hypothesis.
(H0: pbrown=0.12,pyellow=0.15,pred=________,pblue=________,porange=______,pgreen=______
H1: At least one of the proportions is different from that given by M&M/Mars )
(b) The observed frequencies are given in the table below. Calculate the expected frequencies and enter them in the table. We first calculated n, the total number of M&M’s in the sample and found that n=400. Then we calculate Ei=n*pi=400*pi.
|
Color
|
Observed Frequency
|
Expected Frequency
|
O - E
|
(O - E)2
|
(O - E)2 / E
|
|
Brown
|
53
|
400*.12 = 48
|
|
|
|
|
Yellow
|
66
|
|
|
|
|
|
Red
|
38
|
|
|
|
|
|
Blue
|
96
|
|
|
|
|
|
Orange
|
88
|
|
|
|
|
|
Green
|
59
|
|
|
|
|
|
Total
|
n= 400
|
|
|
|
|
(c) Calculate the value of the χ2 test statistic using the formula and the table above. (use the example on p. 461)
∑[(Oi-Ei )2/Ei] .
Also give the number of degrees of freedom.(Remember that df = k – 1, where k is the number of categories.)
(d) Find the P-value using the χ2cdf on your calculator.
(e) State your decision at the α = 0.05 level of significance.
(f) State your conclusion about the distribution of colors of peanut M&M’s.
2. A researcher wanted to determine whether bicycle deaths were uniformly distributed over the days of the week. She randomly selected 200 deaths than involved a bicycle, recorded the day of the week, and obtained the reults in the table below. Is there reason to believe that bicycle fatalities occur with equal frequency with respect to day of the week?
(a) State the null and alternative hypotheses. (These will be similar to the hypotheses in Problem 1 except that this time the null hypothesis is that the distribution is uniform, which means that the proportions are the same on all 7 days of the week.)
(b) Calculate the sample size, n,and the expected frequencies, and enter them in the table below. (All of the expected frequencies should be the same.)
|
Outcome
|
Observed Frequency
|
Expected Frequency
|
|
Sunday
|
16
|
|
|
Monday
|
35
|
|
|
Tuesday
|
16
|
|
|
Wednesday
|
28
|
|
|
Thursday
|
34
|
|
|
Friday
|
41
|
|
|
Saturday
|
30
|
|
|
Total
|
n=
|
|
(c) Calculate the χ2 test statistic using either the formula or the χ
2GOF-Test on your calculator. Also give thenumber of degrees of freedom.
(d) Give the P-value.
(e) State your decision at the α = 0.05 level of significance.
(f) State your conclusion.
True or False. If the statement is false rewrite it as a true statement.
3. The chi-square distribution is symmetric.
4. The alternate hypothesis for a goodness-of-fit test says that some of the probabilities differ from those specified by the null hypothesis.
Assignment on the Test of Independence – Sec 10.2
1. The bar graph below displays the relationship between level of health and the level of happiness for a random sample of individuals from the General Social Survey.
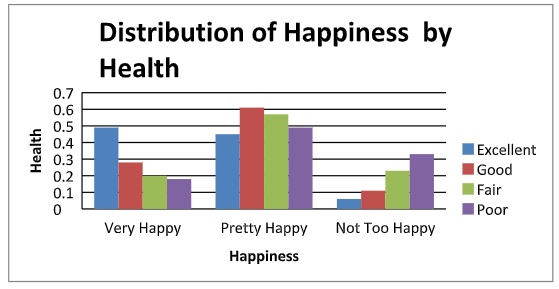
According to the bar graph, the health and happiness of the individuals in the sample do seem to be related. Follow the instructions below to use the Test of Independence to test whether or not these variables are dependent. Use the significance level α = 0.05.
(a) State the null and alternative hypotheses
(b) Calculate the row and column totals and the overall total and enter those values in the chart below.
|
|
Excellent
|
Good
|
Fair
|
Poor
|
|
Very Happy
|
271
|
261
|
82
|
20
|
|
Preety Happy
|
247
|
567
|
231
|
53
|
|
Bot Too Happy
|
33
|
103
|
92
|
36
|
|
Total
|
|
|
|
|
(c) Use your graphing calculator to carry out the Test of Independence. Report the test statistic and the number of degrees of freedom.
(d) Give the P-value.
(e) State your decision.
(f) State your conclusion about whether or not there is enough evidence to conclude that the variables Happiness and Health are dependent.
(g) Enter the expected frequencies in the table below. Show how at least one of these frequencies was calculated. (These can be read from matrix [B] on your calculator after you complete the test. Remember that)
|
|
Excellent
|
Good
|
Fair
|
Poor
|
|
Very Happy
|
|
|
|
|
|
Preety Happy
|
|
|
|
|
|
Bot Too Happy
|
|
|
|
|
2. The table below contains a data on whether or not patients taking Celebrex and other arthritis medications suffered dizziness as a side effect. Test whether or not there is a difference among treatment groups in the proportion of patients who reported dizziness as a side effect.
|
|
Celebrex
|
Placebo
|
Naproxen
|
Diclofenac
|
Ibuprofen
|
|
Dizziness
|
83
|
32
|
36
|
5
|
8
|
|
No Dizziness
|
4063
|
1832
|
1330
|
382
|
337
|
(a) Complete the null and alternative hypotheses below: = _________ = __________
(b) Give the value of the test statistic and the degrees of freedom.
(c) Give the P-value.
(d) State your decision. Use the significance level α = 0.05.
(e) State your conclusion about whether or not there is evidence of a difference in proportions of patients experiencing dizziness as a side effect among the five treatment groups.
(f) Enter the expected frequencies in the table below (from matrix [B]).
|
|
Celebrex
|
Placebo
|
Naproxen
|
Diclofenac
|
Ibuprofen
|
|
Dizziness
|
|
|
|
|
|
|
No Dizziness
|
|
|
|
|
|