Reference no: EM131701
PROBLEM1: The data below shows the Number of absences X and the Final Grade, Y of seven students in the statistics class.
|
Student
|
Number of absences x
|
Final Grade y
|
|
A
|
6
|
82
|
|
B
|
2
|
86
|
|
C
|
15
|
43
|
|
D
|
9
|
74
|
|
E
|
12
|
58
|
|
F
|
5
|
90
|
|
G
|
8
|
78
|
a.
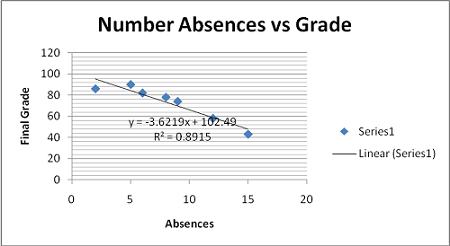
The relationship is linear. The negative slope shows that the relationship is negative; the more number of absences the lower the grade.
b.
|
|
X
|
Y
|
XY
|
X2
|
Y2
|
|
6
|
82
|
492
|
36
|
6724
|
|
2
|
86
|
172
|
4
|
7396
|
|
15
|
43
|
645
|
225
|
1849
|
|
9
|
74
|
666
|
81
|
5476
|
|
12
|
58
|
696
|
144
|
3364
|
|
5
|
90
|
450
|
25
|
8100
|
|
8
|
78
|
624
|
64
|
6084
|
|
SUM
|
57
|
511
|
3745
|
579
|
38993
|
r = (7*3745-57*511)/squareroot[(7*579-572)*(7*38993-5112)] =
= -2912/squareroot(804*11830)=-2912/3084.043= -.944
The correlation coefficient is -.944: It shows a very strong, negative relationship between the number of absences and the obtained grades.
r2 = 89.15%. It represents the percent of the variances in the values of Y that can be explained by knowing the value of X. 89.15% of the variation of Y (number of absences) is explained by X (grades) and 10.85% is unexplained.
PROBLEM 2: The data below shows the reading (x) and math scores (y) of students.
|
Reading Scores
|
Math Scores
|
|
1
|
4
|
|
2
|
3
|
|
3
|
8
|
|
3
|
6
|
|
4
|
7
|
|
5
|
7
|
|
6
|
8
|
|
7
|
8
|
|
7
|
9
|
|
8
|
10
|
|
8
|
9
|
|
9
|
8
|
PROBLEM 3
The data below shows the score on a promotion test given to police officers and the number of hours studied. Calculate the correlation coefficient.
|
Hours Studied
|
Score on promotion test
|
|
0
|
0
|
|
1
|
1
|
|
2
|
1
|
|
3
|
2
|
|
4
|
5
|
|
6
|
6
|
|
12
|
8
|
|
16
|
10
|
PROBLEM 4: An emergency service wishes to see whether there a relationship exists between the outside temperature and the number of emergency calls it receives for a 7 hours period. The data is shown below.
Temperature x | 68 74 82 88 93 99 101
Number of calls | 7 5 7 9 11 12 15
PROBLEM 5:
A company that manufactures small lathes is interested in establishing standards for employees. A random sample of 18 employees is selected in order to develop the standards. The data collected is below.
A manager at the firm feels that assembly time is related to intelligence. She feels that employees who did well in high school (as measured by high school averages) should be able to do the job faster. Does the data support her hunch?
|
high school
average
|
Time to
assemble lathe
(minutes)
|
|
50
|
52
|
|
62
|
53
|
|
65
|
62
|
|
68
|
70
|
|
71
|
73
|
|
73
|
78
|
|
75
|
80
|
|
79
|
82
|
|
80
|
85
|
|
82
|
86
|
|
83
|
90
|
|
85
|
94
|
|
88
|
95
|
|
90
|
106
|
|
90
|
111
|
|
94
|
120
|
|
94
|
139
|
|
100
|
145
|
|
Identify and describe the organizational authentication
: Identify and describe the organizational authentication technology and network security issues
|
|
Health economics assignment
: Health economic theory and practice
|
|
Evaluate the correlation coefficient
: Evaluate the correlation coefficient.
|
|
Least squares
: For homework consider the points (0,0), (1,2), (2,3), (3,9), ( 4,17), (5,24), (6,37). (1) Use Matlab to find the least squares best fit with a line. Turn in A, y and c and a plot like the one above. Also (2) use Matlab to find the least square best..
|
|
Calculate the correlation coefficient
: Calculate the correlation coefficient
|
|
The problem of operating a warehouse
: Consider the problem of operating a warehouse, by buying and selling the stock of a certain commodity, in order to maximize profit over four periods.
|
|
Create a multi-threaded competition
: Create a multi-threaded competition
|
|
Evaluate particle diameter at different gas velocities
: Evaluate particle diameter at different terminal gas velocities
|
|
The american patent system was based on the presumption
: The American patent system was based on the presumption that social welfare coincided with the individual welfare of inventors
|