Reference no: EM131317434
Part A - Excel Instructions for Chi-square Tests
Carrying out Chi-square (χ2) tests of independence
We are considering prisoner behaviour data. There is a prison with six wings each with 100 prisoners. Prisoner behaviour is recorded for three groups, (Group A is well behaved, Group B moderately behaved and Group C are real bad guys!) as follows:
|
|
Group A
|
Group B
|
Group C
|
TOTAL
|
|
Wing 1
|
53
|
27
|
20
|
100
|
|
Wing 2
|
72
|
26
|
2
|
100
|
|
Wing 3
|
92
|
7
|
1
|
100
|
|
Wing 4
|
40
|
35
|
25
|
100
|
|
Wing 5
|
25
|
48
|
27
|
100
|
|
Wing 6
|
47
|
51
|
2
|
100
|
|
TOTAL
|
329
|
194
|
77
|
600
|
(a) Examine the table. What is the overall pattern you see, and are there any departures from that pattern?
(b) Calculate appropriate percentages. Why is it useful to do this?
|
|
Group A
|
Group B
|
Group C
|
TOTAL
|
|
Wing 1
|
53%
|
27%
|
20%
|
100%
|
|
Wing 2
|
72%
|
26%
|
2%
|
100%
|
|
Wing 3
|
92%
|
7%
|
1%
|
100%
|
|
Wing 4
|
40%
|
35%
|
25%
|
100%
|
|
Wing 5
|
25%
|
48%
|
27%
|
100%
|
|
Wing 6
|
47%
|
57%
|
2%
|
100%
|
|
TOTAL
|
55%
|
32%
|
13%
|
|
|
|
# of Group C Prisoners
|
% of Group C Prisoners
|
|
Wing 1
|
20
|
25%
|
|
Wing 2
|
2
|
3%
|
|
Wing 3
|
1
|
2%
|
|
Wing 4
|
25
|
32%
|
|
Wing 5
|
27
|
35%
|
|
Wing 6
|
2
|
3%
|
|
TOTAL
|
77
|
100%
|
(c) The chi-square test can be used to investigate the association between the row variable (group) and the column variable (wing).
(d) Note that CHISQ.TEST does not give the chi-square statistic, only the p-value. Recall that the test statistic is Σ(Oi - Ei)2/Ei. We can obtain it as follows.
(e) When we calculate the chi-square statistic in Excel we calculate the contribution of each cell to the overall value of χ2. Those cells with large contributions are the cells where the observed frequencies are very different from the frequencies expected under the hypothesis of independence.
Which cells show the most departure from their expected values? What explanation can you suggest for these departures?
Part B -
Question 1 - The owner of a petrol station wants to study petrol-purchasing habits by motorists at this station. He selects a random sample of 61 motorists during a certain week and observed a mean of 37 litres with a standard deviation of 11.7 litres.
- Is there evidence that the mean purchase is less than 38 litres? Use a 5% test.
Note: All intermediate calculations must be reported to 4 decimal places before performing the final calculation.
Multiple choice questions:
- The population parameter of interest is(chose from below)
- The null hypothesis is(chose from below)
- The alternative hypothesis is(chose from below)
- The level of significance is(chose from below)
- The test statistic is(chose from below)
- The p-value is(chose from below)
- The decision is(chose from below)
- Based on the sample, there is(chose from below)
Multiple Choice for the above questions:
-0.05
-µ ≤ 38
-reject H0
-0.5070
-µ ≥ 380.01
-0.6675
-the mean purchase of all motorists
-0.10
-0.2535
-μ > 380.6675
-do not reject H0
-μ < 38
-sufficient evidence at the 5% significance level to conclude that the mean purchase is less than 38 litres
-insufficient evidence at the 5% significance level to conclude that the mean purchase is less than 38 litres
Question 2 - A manufacturer claims that the percentage of defective items in his production line is 20%. A random sample of 400 items was tested and indicated 22% of defective items.
-To perform an appropriate hypothesis test to determine if the manufacturer's claim is supported by the data, which hypotheses should you test?
Select one:
- H0: π = 0.22 vs H1: π ≠ 0.22
- H0: π = 0.2 vs H1: π ≠ 0.2
- H0: p = 0.22 vs H1: p ≠ 0.22
- H0: p = 0.2 vs H1: p ≠ 0.2
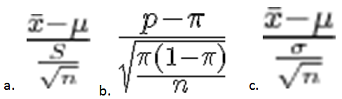
Question 3 - A company that manufactures chocolate bars is particularly concerned that the mean weight of a chocolate bar is not greater than 6.03 ounces. The standard deviation is known to be 0.02 ounces. A sample of 50 chocolate bars is selected and indicated a mean of 6.034 ounces. Which test statistic formula should you use?
Select one:
Question 4 - Before using the p-value associated with a Chi-square test, some assumptions must be verified.
Given that the assumption of randomness is met, which of the following statements would you choose for the expected values?
Select one:
- For a contingency table with more than 2 rows and more than 2 columns, the expected values must be greater than or equal to 5
- All of the answers are correct
- None of the answers are correct
- For a contingency table with 2 rows and 2 columns, the expected values must be greater than or equal to 1
Question 5 - The director of manufacturing at a textile mill needs to determine whether a new machine is producing a particular type of cloth according to the manufacturer's specifications, which indicate that the cloth should have a mean breaking strength of 40 kgs. The standard deviation is known to be 4 kgs. A sample of 49 pieces of cloth reveals a mean breaking strength of 39.1 kgs.
Is there evidence that the mean breaking strength is less than 40 kgs? Use a 10% test.
Note: All intermediate calculations must be reported to 4 decimal places before performing the final calculation.
Multiple choice questions:
- The population parameter of interest is (chose from below)
- The null hypothesis is(chose from below)
- The alternative hypothesis is(chose from below)
- The level of significance is(chose from below)
- The test statistic is(chose from below)
- The p-value is(chose from below)
- The decision is (chose from below)
- Based on the sample, there is (chose from below)
Multiple Choice for the above questions:
-0.1152
-0.01
-the mean breaking strength of all cloth
-reject H0
-μ < 400.10
-insufficient evidence at the 10% significance level to conclude that the mean breaking strength is less than 40 kgs
-do not reject H0
-0.05
-μ > 40
-µ ≥ 401.5750
-µ ≤ 40-1.5750
-sufficient evidence at the 10% significance level to conclude that the mean breaking strength is less than 40 kgs
-0.0576
Question 6 - The Australian Department of Education, Employment and Workplace Relations conducted a survey of 754 companies providing financial advice to customers. The report found that 49% of the 754 companies reported difficulty in finding customers over the previous 12 months.
At the 1% significance level, can you state that the percentage of all companies providing financial advice who had difficulty finding customers is different from 45%?
Note: All intermediate calculations must be reported to 4 decimal places before performing the final calculation.
Multiple choice questions:
- The population parameter of interest is (chose from below)
- The null hypothesis is(chose from below)
- The alternative hypothesis is(chose from below)
- The level of significance is(chose from below)
- The test statistic is(chose from below)
- The p-value is(chose from below)
- The decision is (chose from below)
- Based on the sample, there is(chose from below)
Multiple Choices for the above questions:
-π ≠ 0.45
-reject H0
-π = 0.45
-0.10
-0.05
-2.2078
-0.0136
-do not reject H0
-2.2078
-sufficient evidence at the 1% significance level to conclude that the proportion of all companies providing financial advice who had difficulty finding customers is different from 45%
-insufficient evidence at the 1% significance level to conclude that the proportion of all companies providing financial advice who had difficulty finding customers is different from 45%
-0.01
-the proportion of all companies providing financial advice who had difficulty finding customers
-0.0273
Question 7 - The Westfield Female Fashion Study surveyed customers to determine characteristics of the "frequent" shoppers at different Westfield department stores in Australia. Suppose you are a marketing manager at one of the department stores. You would like to know if a customer's shopping frequency is associated to her age.
|
Shopping frequency
|
Age
|
|
|
18-24
|
25-44
|
45-54
|
|
Never/Hardly Ever
|
32
|
45
|
24
|
|
1-2 times per year
|
18
|
40
|
37
|
|
3-4 times per year
|
21
|
48
|
27
|
|
More than 4 times per year
|
39
|
71
|
50
|
- At the 5% significance level, is there evidence of an association between age and shopping frequency?
- You will need to enter the data (given in the contingency table above) into Excel to answer the questions below.
- The chi-square test statistic and the p-value must be reported to 4 d.p.
Note: The answer to the last question must be written as either: not rejected or rejected
- The chi-square test statistic is
- The associated p-value is
- This means that H0, that there is no association between age and shopping frequency, should be
Question 8 - A hypothesis test has a test statistic which follows a t-distribution with 14 degrees of freedom. It is a two-tailed test. The value of the test statistic is 2.624 and the level of significance is 1%. What decision should you make?
Select one:
- Accept H0:
- Reject H0:
- Do not reject H0:
- Reject H1:
- Do not reject H1:
Question 9 - For a contingency table with 6 rows and 6 columns, the degrees of freedom associated with a Chi-square test is:
Select one:
- 12
- 4
- 9
- 25
- 16
Attachment:- Assignment.rar