Reference no: EM133975447
Information Security and Assurance in a Networked World
Assignment
Part 1. Image Representation
There are 10 images in a collection saved under the compressed file IA3.zip. All of these images are in .png format. In this assignment, you are asked to process these images, so that they will be converted to arrays as the final output. In particular, please follow the steps below:
1. Read in all 10 images in python, resize each of them to 100 by 100 pixels format.
2. Convert each of them to greyscale arrays (no color information needs to be kept, so the arrays will be 2-D).
3. Flatten the 2-D array for each image to a 1-D array (vectors), draw a histogram to present the intensity value distribution for each of the images.
4. Conduct a histogram equalization to normalize each image, draw a histogram to present the intensity value distribution of each of the images after normalization.
5. Compare the histogram in step 4 with step 3, discuss what the difference is.
hint: you may consider using "for" loops, so you could process the whole collection at once.
For Part 1, please submit two files:
A Jupyter Notebook file .ipynb which includes your python code with your comments # or markdowns, and the results of each successful running through. Use a markdown at the end of the .ipynb file to answer the question in step 5. Enjoy trusted, budget-friendly assignment help from today onward!
A CSV file which contains flattened arrays (step 3), each image should be a row, and there should be 100*100 columns.
Part 2. CNN - Digit Recognition
We will build a CNN classifier to recognize hand-written digits 0-9. We are using the mnist (Modified National Institute of Standards and Technology) dataset, which can be loaded by: (train_digits, train_labels), (test_digits, test_labels) = datasets.mnist.load_data() It contains black and white images (28 x 28 pixels) and their labels of hand-written digit (60,000 in training set and 10,000 in test set).
1. Plot the first 9 images:
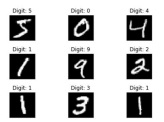
Use plt.title() to display the labels with the format "Digit: 5" for example. You may
want to use fig = plt.figure(layout='tight') to avoid overlaps
2. Prepare the data by:
train_digits = train_digits.reshape(60000,28,28,1) train_labels = tf.keras.utils.to_categorical(train_labels, 10) Do the same for the test set.
3. Build your CNN model with Conv2D with (3, 3) filters and MaxPooling2D((2, 2)). Show the summary of your model. You may want to set the output layer as: model.add(layers.Dense(10, activation='softmax'))
4. Compile and train your model. Consider the choices of optimizer, loss, and epochs. What are your accuracy and val_accuracy? You may want to set the loss as: loss=tf.keras.losses.CategoricalCrossentropy()
5. Plot the history of model training against epoch.
6. Evaluate the model with the test data. For Part 2, please submit one file:
A Jupyter Notebook file .ipynb which include your python code with your comments # or markdowns, and the results of each successful running through.