Reference no: EM133140632
CMP9135M Computer Vision - University of Lincoln
Description of Assessment Task and Purpose:
Learning Outcome 1: Critically evaluate and apply the theories, algorithms, techniques and methodologies involved in computer vision.
Learning Outcome 2: Design and implement solutions to a range of computer vision applications and problems, and evaluate their effectiveness.
Requirements:
This assessment comprises three assessed tasks, as detailed in the following page.
1. Image segmentation and detection. Weight: 40% of this component
2. Feature calculation. Weight: 30% of this component
3. Object tracking. Weight: 30% of this component
Task 1: Image Segmentation and Detection
Download and unzip the file ‘skin lesion dataset.zip' from Blackboard. You should obtain a set of 120 images. Among those images, there are 60 skin lesion colour images and 60 corresponding binary masks (ground-truth segmentation).
Please use image processing techniques to implement the following tasks. Please note that you are encouraged to develop one model with same parameter settings for all the images.
Task 1: Object segmentation. For each skin lesion image, please use image processing techniques to automatically segment lesion object. Examples of the lesion image (Fig.1(a) and the segmented lesion (Fig.1(b)) are shown in Figure 1.
Task 2: Segmentation evaluation. For each skin lesion image, calculate the Dice Similarity Score (DS) which is defined in Equation 1; where M is the segmented lesion mask obtained from Task 1, and S is the corresponding ground-truth binary mask.
DS = 2|M∩S|/|M|+|S| (1)
The calculated DS shall be between 0 and 1. For example, DS is 1 if your segmentation matches perfectly with the ground-truth mask, whist DS is 0 if there is no overlap between your segmentation and ground-truth mask.
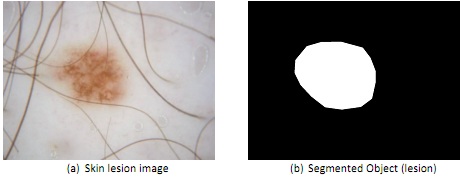
Figure 1. Skin Lesion Segmentation
Your report should include: 1) For three skin images (ISIC_0000019, ISIC_0000095 and ISIC_0000214), you are required to put the original images, final segmented lesion binary images, the calculated DS value for each of the three images; 2) for all the 60 skin images, please provide a bar graph with x-axis representing the number of the image, and y-axis representing the corresponding DS. 3) Calculate the mean and standard deviation of the DS for all the 60 images.
4) briefly describe and justify the implementation steps.
Task 2: Feature Calculation
Download the Image (‘ImgPIA.jpeg') from Blackboard. This part of the assignment will deal with the area of Feature Extraction, in both the Frequency and Spatial domains.
Task 1: Read the image (‘ImgPIA.jpeg'), and select the features for both radius and direction as described in the Spectral Approach session of the Feature Extraction lecture. For additional marks you can change the values of radius and angle, and present those values in a plot or table.
Task 2: Read the image (ImgPIA.jpeg), and select features from the image histogram (i.e. 1st order), at least six (6) features from the co-occurance matrix (the original paper by Haralick has also made available to you), and at least five (5) features from the Gray Level Run Length (GLRL) matrix. Please note that both the co-occurance and GLRL based features can be directional and as a function of distance between pixel co-ordinates. For additional marks you can change the bit-depth of the image (i.e. 8, 6, 4 bit), and recalculate the features presenting them as a plot or table.
For both tasks analysis and discussion of your findings is expected.
Task 3: Object Tracking
Download from Blackboard the data files 'x.csv' and 'y.csv', which contain the real coordinates [x,y] of a moving target, and the files 'a.csv' and 'b.csv', which contain their noisy version [a,b] provided by a generic video detector (e.g. frame-to-frame image segmentation of the target).
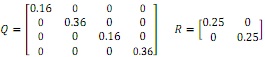
Implement a Kalman filter with a software application that accepts as input the noisy coordinates [a,b] and produces as output the estimated coordinates [x*,y*]. For this, you should use a Constant Velocity motion model F with constant time intervals Δt = 0.1 and a Cartesian observation model H. The covariance matrices Q and R of the respective noises are the following:
1) You should plot the estimated trajectory of coordinates [x*,y*], together with the real [x,y] and the noisy ones [a,b] for comparison.
2) You should also assess the quality of the tracking by calculating the mean and standard deviation of the absolute error and the Root Mean Squared error (i.e. compare both noisy and estimated coordinates to the ground truth).
Attachment:- Computer Vision.rar