Reference no: EM131003654
PART A
Question 1:
The lecturer of business statistics teaching a large lecture wanted to compare the performance of his students on the three exams that are given during the semester. The exams each cover one portion of the semester and are not cumulative. The scores on exam 3, for a sample of 33 students, follow.
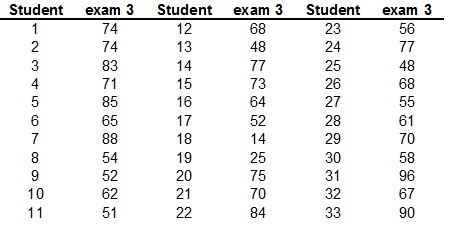
a. Use an ordered stem and leaf display, to sort the scores from exam 3.
The descriptive statistics for each of the three exams, follows:
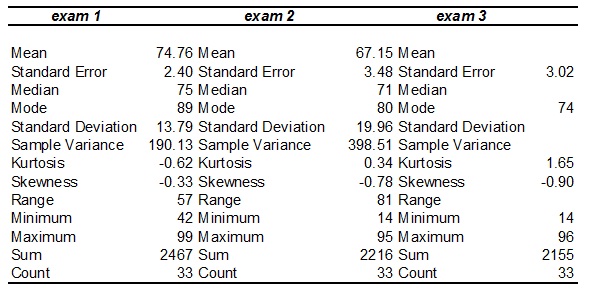
b. Use the display prepared in part a. to help you find the missing values in the descriptive statistics table for the scores from exam 3. Working does not need to be shown where the statistics functions on the calculator are used.
The boxplot for each of the three exams, follows:
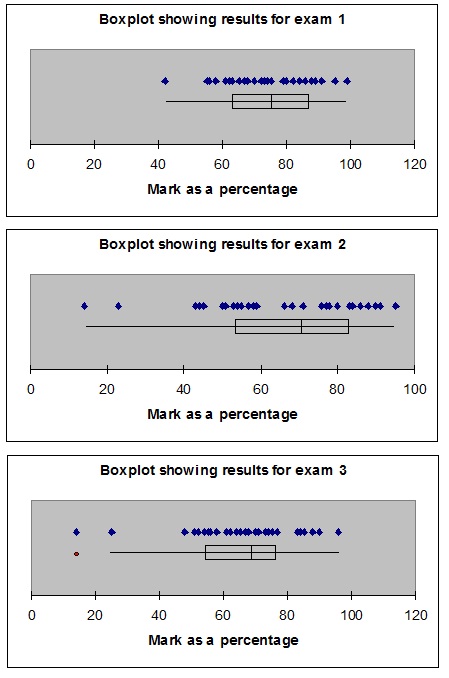
Examine all the output provided. Use this output to help you answer the following questions.
c. The scores for one exam are more consistent than for the other two exams. Which exam is this. Give three valid statistical reasons for choosing this exam.
d. The lecturer believes he has set a ‘fair' exam, if at least 75% of students pass the exam (score more than 50%). Given this condition, which exam(s) would he consider to have been fair? Explain.
e. For which exams would the median provide the best indication of the average score? Why?
Question 2:
a. A quality control engineer has been asked to examine a complex electronic system that is currently operating out of control. His examination will involve testing six switching mechanisms within the system and identifying the one that is at fault. Assume that one and only one switching mechanism is faulty. The switching mechanisms are randomly chosen for examination by the engineer but excluded from further consideration if found to be satisfactory.
i. What is the probability that the faulty switching mechanism will be discovered during the second examination?
ii. What is the probability that the faulty switching mechanism will be discovered before the fourth examination?
b. It is known that 90% of those who purchase a colour television will not have claims against the guarantee during the duration of the guarantee. Suppose that each of 25 customers buys a colour television from a certain electrical store.
i. What is the probability that at least 4 of these 25 customers will have claims against their guarantee?
ii. What is the probability that exactly 5 of these customers will have claims against their guarantee?
iii. What is the expected value and standard deviation of the number of claims from 25 buyers?
c. A manger of a women's store wishes to determine the relationship between the type of customer and the type of payment. She has collected the following data.
Payment
Customer Credit Cash
Regular 70 50
Non regular 40 40
If a customer is selected at random, what is the probability that
i. The customer is regular?
ii. The customer is regular or buys on credit?
Question 3:
a. A production process for steel rods, used to reinforce concrete, is known to produce rods whose lengths have a variance of 64 square centimetres. The production machinery has been set to produce rods with a mean of 600 centimetres in length. These rods are tied into bundles of 40 for shipment to the construction sites.
i. What is the probability that the average length of a randomly selected bundle is less than 598cm?
ii. What is the probability that the average length of a randomly selected bundle is less than 598cm or more than 601cm?
iii. If a construction worker randomly selects one rod from a bundle, what is the probability that the rod is less than 598cm?
b. With increased concern over maintaining adequate cash flow, a builders' supply company wishes to estimate the average amount owed to it by its credit customers. For this purpose, 25 of the company's invoices are randomly sampled and are found to possess an average credit balance of $3200 with a standard deviation of $350. Calculate a 95% confidence interval estimate for the average credit balance for all credit customers of the supply company.
c. Manufacturers of photographic equipment have introduced many new easy-to-use cameras, film types and flash equipment in recent years. A new type of flashbulb was tested to estimate the proportion of new bulbs that would produce the required light output at the appropriate time. A sample of 1000 bulbs was tested and 920 were observed to function according to specifications.
i. Find a 99% confidence interval estimate for the true proportion of bulbs functioning according to specifications.
ii. How large a sample should be taken in order to estimate the proportion to within 2%, with 99% confidence?
Question 4:
a. A small soft drink bottle carries a claim on its label that the bottle contains 500ml of soft drink. To examine the validity of this claim, a consumer group randomly selects a sample of 50 bottles of the soft drink and finds an average content of 495ml with a standard deviation of 10ml. Test at α = 0.01 to see whether the data present sufficient evidence to support a claim by the consumer group that the bottles are under filled.
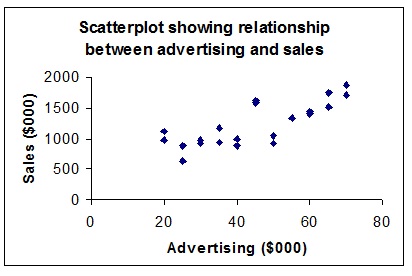
b. The manager of a large company was interested in the effect radio and television advertising had on sales. He collected data on advertising expenditure ($000) and sales ($000) for a random sample of 22 weeks. A simple linear regression analysis of the relationship between advertising expenditure and sales was performed. The computer output generated by Excel follows.
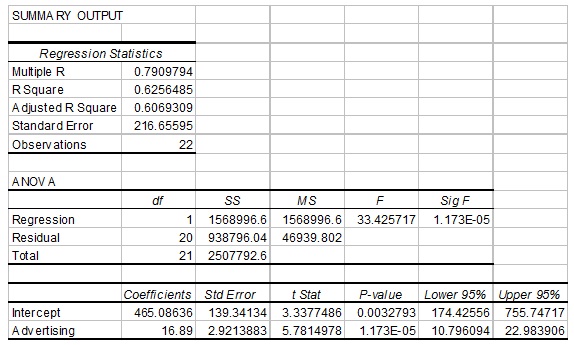
Use the output provided to answer the following questions.
i. Determine the regression equation to predict sales from advertising expenditure.
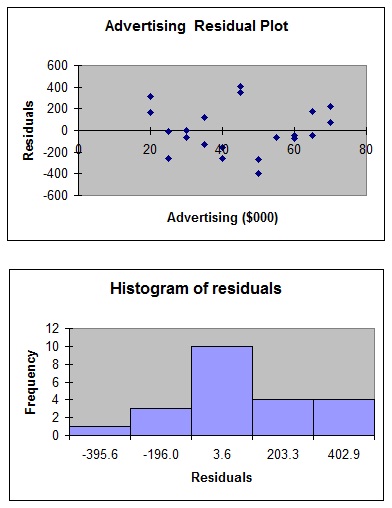
ii. One of the required conditions for the validity of regression analysis is that the error variable must be normally distributed. Explain how we would verify this from the output provided and comment on whether this condition has been violated here.
iii. From the scatterplot, it appears that sales are linearly related to advertising expenditure. Test this relationship at a 1% level of significance.
iv. For the estimated model, what is the coefficient of determination. Interpret this value.
PART B:
1. Hungry Jacks has recorded the size of the fries (regular, medium, large, extra large) ordered by a sample of 100 customers. The data recorded are
A. quantitative and ordinal.
B. qualitative and ordinal.
C. quantitative and nominal.
D. qualitative and nominal.
E. quantitative and ratio.
2. You have recorded the heights of five of your classmates. On the basis of this information, you have made the following statement. "The average height of all students at the university is 170cm." This is an example of
A. a parameter.
B. a population
C. descriptive statistics
D. inferential statistics.
E. a distribution.
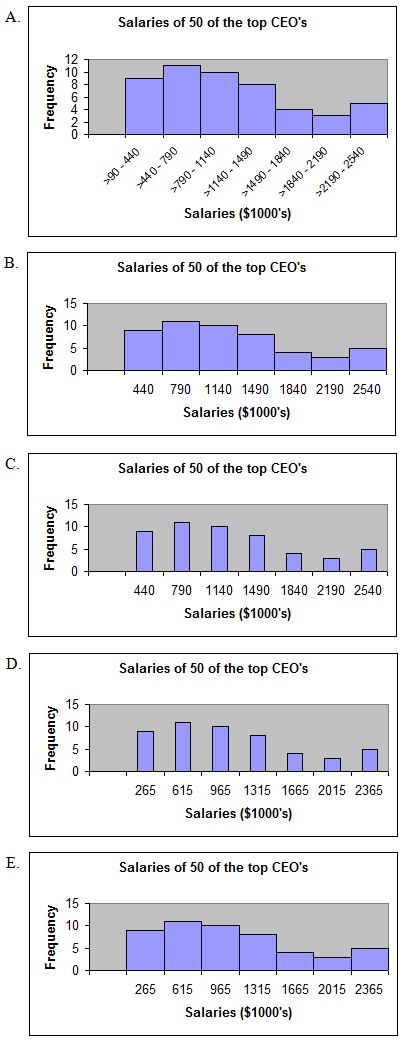
3. The salaries in thousands of dollars of 50 CEO's from the top corporations is given in the following frequency table.
Salary (in $000's) Frequency
>90 up to and including 440 9
>440 up to and including 790 11
>790 up to and including 1140 10
>1140 up to and including 1490 8
>1490 up to and including 1840 4
>1840 up to and including 2190 3
>2190 up to and including 2540 5
Excel has been used to construct a histogram to represent the frequency distribution above. The most correct histogram would be
4. Which of the following statements is true?
A. When the distribution is skewed to the left, mean > median > mode.
B. When the distribution is skewed to the right, mean < median < mode.
C. When the distribution is skewed to the left, mean > median.
D. When the distribution is unimodal and symmetric, mean = median = mode.
E. When the distribution is bimodal and symmetric, mean = median = mode.
5. The best type of chart for comparing two sets of categorical data is
A. a line chart.
B. a frequency distribution.
C. a histogram.
D. a frequency polygon.
E. a grouped bar chart.
6. Given that z is a standard normal random variable, find P(z < 1.8)
A. 0.9641
B. 0.8599
C. 0.4641
D. 0.3599
E. 0.0359
7. If A and B are mutually exclusive events where P(A) = 0.2 and P(B) = 0.3, then P(A and B) is
A. 0.05
B. 0.6
C. 0.06
D. 0
E. 0.1
Use the following information to answer questions 8. and 9.
The number of computer malfunctions in an accountancy firm occur randomly and independently at an average rate of 3 malfunctions per month.
8. Calculate the probability that at least three malfunction will occur in a given month.
A. 0.353
B. 0.577
C. 0.224
D. 0.423
E. 0.647
9. Calculate the probability that less than four malfunctions will occur in the next two months.
A. 0.647
B. 0.285
C. 0.151
D. 0.715
E. 0.849
10. Given that z is a standard normal random variable, find the value for c such that P(-c < z < c) = 0.8664
A. 1.5
B. 0.4332
C. 0.1664
D. -1.5
E. cannot be determined from the information provided.
11. If P(A|B) = 0.6, P(A) = 0.5 and P(B) = 0.4, then P(A or B) is
A. 0.66
B. 0.90
C. 0.24
D. 0.16
E. 0.50
12. A home owner claims that the current market value of his house is $250 000. An assessor believed the house to be worth more than $250 000. Sixty real estate agents were asked independently to estimate the house's value. The hypothesis test that followed ended with a decision to ‘reject Ho'. Which of the following statements accurately states the conclusion?
A. The home owner is correct, the house is worth $250 000.
B. The home owner is correct, the house is worth more than $250 000.
C. The home owner is incorrect, the house is worth less than $250 000.
D. The home owner is incorrect, the house is worth more than $250 000.
E. The home owner is incorrect, he should not sell his house.
13. A given sample for a hypothesis test yields a p-value of 0.02. For this situation
A. at α = 0.001 we reject Ho.
B. at α = 0.01 we reject Ho.
C. at α = 0.05 we reject Ho.
D. at α = 0.1 we do not reject Ho.
E. rejection of Ho depends on whether we have a 1-tailed or 2-tailed test.
Use the following information to answer questions 14 and 15.
We are performing a hypothesis test where Ho : μ = 50, HA : μ ≠ 50, x‾ = 53.2, s = 20, n = 49, α = 0.05
14. The test statistic would be
A. z = 1.12
B. z = -1.12
C. t = 1.12
D. t = -1.12
E. t = 0.16
15. The decision rule would be
A. reject Ho if tsample > 1.676
B. reject Ho if |tsample| > 2.009
C. reject Ho if zsample ≠ 1.645
D. reject Ho if |zsample| > 1.96
E. reject Ho if tsample > 2.009
16. When performing a simple linear regression, the smallest value the standard error of estimate can take is
A. 2
B. -2
C. 1
D. -1
E. 0
17. Which of the following statistics and procedures can be used to determine whether a linear regression model should be employed.
A. the standard error of estimate
B. the coefficient of determination
C. the t - test of the slope
D. the residual plot.
E. all of the above.
18. The Pearson correlation coefficient r is 1 when,
A. there is no explained variation.
B. there is no unexplained variation.
C. there is no y-intercept in the model.
D. there are outliers.
E. the two variables are not linearly related.
19. Given the least squares regression line y = 5 - 2x
A. The y-intercept of the regression line is -2
B. The relationship between x and y is positive.
C. The relationship between x and y is negative.
D. As x increases, so does y.
E. As x decreases, so does y.
20. Which value of the correlation coefficient r, indicates a stronger correlation than 0.65?
A. 0.45
B. 0.6
C. -0.75
D. 0.7
E. both 0.7 and -0.75.