Reference no: EM132151412
Analytics in Practice
Assignment
Visualisation and storytelling
To do good storytelling, we certainly need to make sure that our visuals are done properly. By that, it means that the visual is conveying facts correctly and is itself factual, and it does deliver the intended message to the audience. This is increasingly becoming important among employers and in some instances, visualisation questions are part of the interview process to ascertain your suitability as a data scientist hire.
In interview scenarios, the common kind of ‘test' comes in the form of (i) asking you to comment on an existing/given visualisation or (ii) asking you to walk them through the process of graphing a small data set. The aim is to ensure that you not only understand analytics but also the art of communicating that to stakeholders effectively.
In this assignment, you will be asked to undertake three tasks related to the above.
Tasks
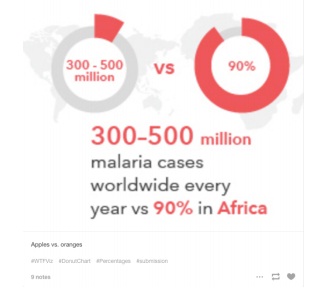
1. The figure below is taken from one of the visualisation sites that was discussed in Week 9 (1st Oct 2018). As noted by the Twitter poster, this was a case of "apple vs oranges".
a. Comment what is wrong with this visual.
b. Provide a visual to show how you would improve it.
2. You have been given a small data file containing different brands of cereals and their nutritional information. This file was provided to you by Kelloggs, which you can download from the LMS.
Kelloggs has asked you to produce suitable visualisation(s) and to suggest a narrative that will position Kelloggs' products as one of the best to consider compared to the competitors.
a. The various columns are self-explanatory except for Manufacturer, where the codes are as follows: G = General Mills, K = Kelloggs, N = Nabisco, P = Post, Q = Quaker Oats and R = Ralston Purina.
b. The Type column here refers to whether the product is served hot or cold (H/C).
c. Provide suitable visuals (maximum of three) and in no more than 250 words, provide a narrative that will accomplish the requirements above.
d. You can approach this by considering Kelloggs as a brand, i.e., not focusing on a particular Kelloggs product, or highlight a particular product (or a few products) from Kelloggs.
|
Determine and print out the number of quarters
: Determine and print out the number of quarters, dimes, nickels, and pennies to add up to that number of cents. No, you can't use all pennies.
|
|
Create a modular program to prepare a customers bill
: During the tax season, every Friday, the J&J accounting firm provides assistance to people who prepare their own tax returns.
|
|
What efforts will be made to optimize the site for search
: Your team have been tasked with developing a management plan and website for a housecleaning company called Sparkling Surfaces Cleaning Company.
|
|
Produce a professional business report
: It is up to you to produce a professional business report with references (APA or Harvard Style) relying on various industry, company, country
|
|
Assignment on visualisation and storytelling
: To do good storytelling, we certainly need to make sure that our visuals are done properly. By that, it means that the visual is conveying facts
|
|
Create a application that allows customers to book table
: Compare and contrast two life cycle models that could be used to complete the project on time, within budget, and with minimal defects.
|
|
Show that the language consisting of those boolean functions
: Show that the language consisting of those Boolean functions that are not tautologies is NP-complete.
|
|
How do you decide which connections to eliminate
: How do you decide which connections to eliminate and which to keep? In other words what information do you need to know about each regional office to determine.
|
|
Components of strategy formulation process
: Analyse some of the key components of strategy formulation process for an organisation
|