Reference no: EM13336830
1. SPC is one of a number of tools which can be used to improve manufacturing quality standards.
(a) Outline two techniques which can be used to decide where to put SPC effort most effectively.
(b) State 3 ways in which the application of SPC can improve quality standards.
(c) State the three basic elements of SPC.
2. From the data given on the next page, produce:
- a tally chart
- a frequency chart
- a ranked frequency chart with cumulative frequencies (work to whole numbers only)
- a Pareto diagram of percentage frequencies and percentage cumulative frequencies (work to whole numbers only).
Data: Record of reasons for rejection of 80 components by 10 types of defects, A to K.
CEECEEKBEC
CCEBICKFKCC
CCEEEEJKJH
EEEECEFCCC
CBBOHFEEBE
AEDEBEBAHC
CKEOHFEEEC
HKEHEECACC.
3. (a) Give examples from your own experience of discrete and continuous variables, and distinguish between the two types.
(b) State the five types of central tendency in general use. Which of these are most frequently used in SPC work?
(c) Calculate the median for the group of results tabulated below: 1,3,4,6,7,9,11,14,16,17,18.
4. (a) What is the mathematical relationship between variance and standard deviation?
(b) Calculate the range and the arithmetic mean for the following set of data.
4,8,16,20,28,32,38,44,48,54,60.
(c) Supply the missing words in the following statement.
'In very many practical SPC cases approximately ................ of the results recorded will lie within a range defined by the mean plus and minus one standard deviation'
5. (a) Sketch the Standard Normal Distribution curve.
(b) State the area under this curve from -00 to +00.
(c) With reference to the Standard Normal Distribution curve, what percentage of results lie within the following ranges?
(i) Mean ±1 standard deviation
(ii) Mean ±2 standard deviation
(iii) Mean ±3 standard deviations.
6. Describe how to assess the capability of any process to meet its requirements and stay within predefined specification limits.
State the different choices of control chart available and the preferred system used by the process industries.
7. For a given process, the upper specification and lower specification limits are set at 2.549 and 2.503 respectively. If the standard deviation for this process is 0.0036 and the mean is 2.530, calculate the following indices.
(i) Process capability index Cp.
(ii) Process capability index CPk.
Using your results, make recommendations as to whether this process is capable, and likely to meet its specification requirements. What are the relative advantages of the two types of process capability index?
8. (a) In the event of a process being found to be incapable, what remedial action should be taken to bring it back within specification limits?
State the two types of causes of variations occurring in a process and provide a brief description of each.
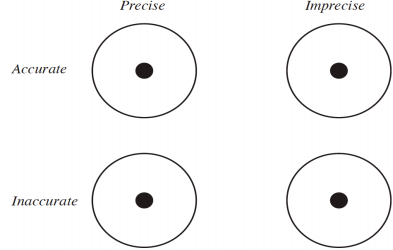
(b) Mark up the diagram opposite, using a pattern of dots in each case, to show the differences between "precise/imprecise" and "accurate/inaccurate" in SPC work.
9.
(a) Write an equation defining the Relative Precision Index.
(b) Two sets of components are being made. Inspection sample size is 4.
For set (1), the Total Specification Tolerance is 0.10 mm, and the average range is 0.05 mm.
For set (2), the Total Specification Tolerance is again 0.10 mm but the average range is 0.02 mm.
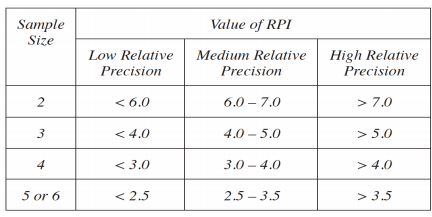
Calculate the Relative Precision Index in each case and, from the table on the following page, state the relative precision for each group.
10.
Control chart systems can operate on two basic methods of measurement. State these two methods and briefly distinguish between them, giving three examples of industrial processes where each might be applied. Specify an appropriate sampling procedure in each case.
11.
(a) Write a brief note stating the circumstances under which cusum charting may be preferable to normal Shewart charting methods.
(b) Calculate the mean of the sample values below, and suggest a suitable value for k, the cusum reference value.
2.07 2.03 1.99 1.99 2.01 2.00 2.05 2.02
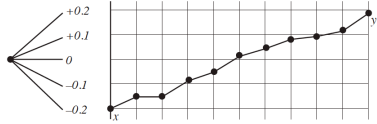
(c) Using the chosen value of k and referring to the cusum chart below, state the process mean between the points x and y.
12. In a manufacturing process, the following data is obtained after examining 10 samples, each of 6 items.
|
Sample
number
|
1
|
2
|
3
|
4
|
5
|
6
|
7
|
8
|
9
|
10
|
|
Range
|
0.09
|
0.08
|
0.10
|
0.11
|
0.12
|
0.08
|
0.13
|
0.08
|
0.09
|
0.12
|
Using this data and the information given below, design and sketch an average control chart, showing upper and lower design limits, upper and lower action limits, and nominal value. Calculate and state the range control limit value.
Nominal size = 12.00 mm, tolerance ± 0.15 mm, Take A"0.025 = 0.90 and D'0.001 = 221.
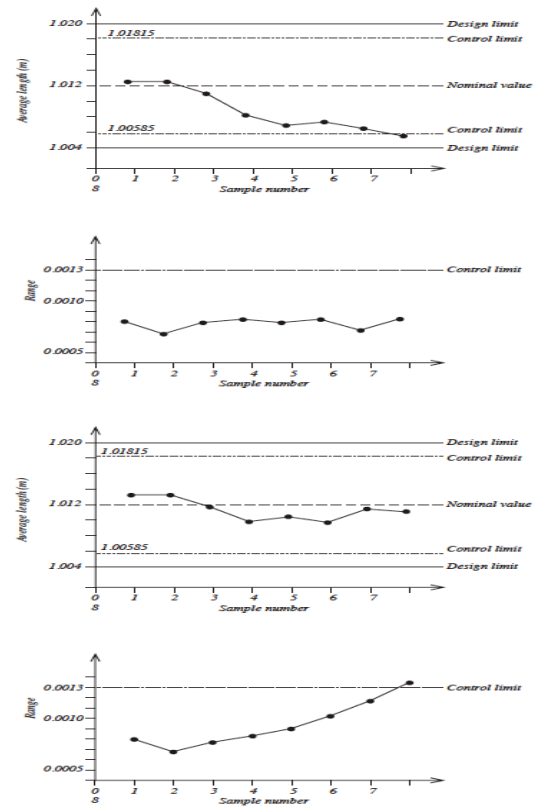
13. Comment on the production control situations depicted by the four control charts shown on the following page, and state what action, if any, would be necessary in each case.
14.
(a) Components are being made in batches of 400, and Inspection Level II is required. Using TABLE 1, determine the BS 6001 code letter.
(b) From your answer to part (a) of this question, and using TABLE 3, determine the sample size that should be drawn.
(c) If an AQL of 2.5 is specified, use TABLE 3 to determine the acceptance and rejection levels applying.
(d) If we assume a 5% defectives level, use FIGURE 1 to determine the percentage of lots we can expect to be accepted.
15. The process for the production of an electrical device is suitable for inspection by variables. Production is inspected in lots of 150, at inspection level II, normal inspection with AQL = 2.5%. The maximum temperature of operation for the device is specified as 50 °C.
(a) Use TABLES 4 and 5 to find the sample code letter, the sample size and the acceptability constant.
(b) A sample is taken and the temperature measurements are as follows: 43 °C, 49 °C, 46 °C, 39 °C, 44 °C, 45 °C, 40 °C, 48 °C, 46 °C and 41 °C.
Determine whether the lot should be accepted.
16. Consider the following scenario:
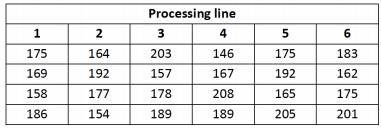
A manufacturer makes silicon strain gauge transducers that are designed to produce a linear voltage output that is directly proportional to the applied pressure. Six different processing lines are used to manufacture the gauges.
In this application an important physical property of the silicon layer formed to fabricate the gauge is its Young's modulus. There have been some calibration problems with the gauges and an engineer suspects that one of the process lines is producing a mean value of Young's modulus that is different from that of the other processing lines.
The Young's modulus of the silicon was measured from a random sample of four gauges taken from each of the processing lines. The results [in GPa] are given in the table below.
Your manager asks you to test the engineer's hypothesis by performing an analysis of variance at the 0.05 level of significance. He has, moreover, heard about 'Six Sigma' and asks you to advise if its introduction would alleviate any supposed issues with the manufacturing of the gauges.
Produce a short report to update your manager on both the method and results of your analysis and the introduction od 'Six Sigma'.