Access the student survey data

Assignment Help Basic Statistics
Reference no: EM131816517

Use software to access the student survey data and complete the following tasks.

a. Report the five-number summary values for the weights of all the students.

b. Use the 1.5  IQR Rule to tell whether the weights of all the students have low outliers, high outliers, or neither.

c. Report the five-number summary values for the weights of the female students.

d. Use the 1.5  IQR Rule to tell whether the weights of the female students have low outliers, high outliers, or neither.

e. Report the five-number summary values for the weights of the male students.

f. Use the 1.5  IQR Rule to tell whether the weights of the male students have low outliers, high outliers, or neither.

g. These boxplots are for weights of females, males, and combined students, but not necessarily in that order.

1470_access the student survey data.png

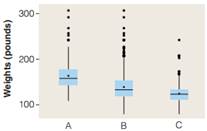
Which of the three groups is represented by boxplot A?

h. Which of the three groups is represented by boxplot B?

i. Which of the three groups is represented by boxplot C?

Reference no: EM131816517

Questions Cloud

What is the lowest acceptable transfer price : According to the formula in the text, what is the lowest acceptable transfer price from the viewpoint of the selling division
Prepare an analysis for transnational using given technique : A large Boston manufacturer has inquired about whether Transnational would be interested in trucking a large order of its parts to Chicago.
Single-factor productivity and multi-factor productivity : which is to include a productivity analysis for his department. One of the inputs is production data prepared by Sharon Walford
Apply the value chain model to flextime : Describe how each of the primary value chain activities pertains to FlexTime. Rank the importance of that activity to FlexTime's success on a scale.
Access the student survey data : Use software to access the student survey data and complete the following tasks.
What would operating income have been with the order : The company typically uses a so-called cost-plus pricing system. Direct-material and direct-labor costs are computed, overhead is added at a rate of 115%.
How did the company handle the sales process : How did the company handle the sales process under its old system? How does CRM integrate with ERP
Stemplot for ages at death : The mean age at death is 15 years and the standard deviation is 7 years. What percentage of the dinosaurs' ages were within 1 standard deviation of the mean?
Prepare a tabulation of the performance for the full year : Prepare a tabulation of the performance for the full year including the final course. Assume that the costs of the final course for the 30 enrollees'.

Reviews

Write a Review

Basic Statistics Questions & Answers

  Statistics-probability assignment

MATH1550H: Assignment:  Question:  A word is selected at random from the following poem of Persian poet and mathematician Omar Khayyam (1048-1131), translated by English poet Edward Fitzgerald (1808-1883). Find the expected value of the length of th..

  What is the least number

MATH1550H: Assignment:  Question:     what is the least number of applicants that should be interviewed so as to have at least 50% chance of finding one such secretary?

  Determine the value of k

MATH1550H: Assignment:  Question:     Experience shows that X, the number of customers entering a post office during any period of time t, is a random variable the probability mass function of which is of the form

  What is the probability

MATH1550H: Assignment:Questions: (Genetics) What is the probability that at most two of the offspring are aa?

  Binomial distributions

MATH1550H: Assignment:  Questions:  Let’s assume the department of Mathematics of Trent University has 11 faculty members. For i = 0; 1; 2; 3; find pi, the probability that i of them were born on Canada Day using the binomial distributions.

  Caselet on mcdonald’s vs. burger king - waiting time

Caselet on McDonald’s vs. Burger King - Waiting time

  Generate descriptive statistics

Generate descriptive statistics. Create a stem-and-leaf plot of the data and box plot of the data.

  Sampling variability and standard error

Problems on Sampling Variability and Standard Error and Confidence Intervals

  Estimate the population mean

Estimate the population mean

  Conduct a marketing experiment

Conduct a marketing experiment in which students are to taste one of two different brands of soft drink

  Find out the probability

Find out the probability

  Linear programming models

LINEAR PROGRAMMING MODELS

Free Assignment Quote

Assured A++ Grade

Get guaranteed satisfaction & time on delivery in every assignment order you paid with us! We ensure premium quality solution document along with free turntin report!

All rights reserved! Copyrights ©2019-2020 ExpertsMind IT Educational Pvt Ltd