There are many approaches to numerically estimating the derivative of the function. The relationship:
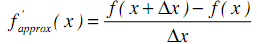
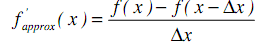
is called a forward difference, since the estimate of the derivative at the point x is generated from the value of the function at x and the value of the function at x+?x (a point forward from x). A backward difference formula estimates the derivative at the point x is from the value of the function at x and the value of the function at x-?x (a point backward from x) as follows:
A central difference formula uses values of the function on either side of the point x in order to estimate the value of the function at x, as follows:
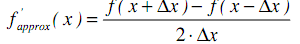
The central difference formula has the advantage that it is more accurate, for a given ?x, than the forward or backward difference formulas.
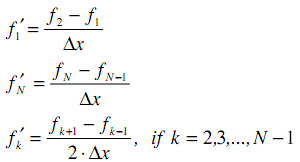
In this problem, we will use a combination of the above techniques to estimate the derivative of a function from a set of measured data points. We will use the following algorithm to estimate the derivative of the function:
where fk is the value of the function at the kth data point, k f ′ is the estimate of the derivative of the function at the kth data point, N is the total number of data points, and x ? is the spacing between data points. Note that we are using a forward difference formula for the first data point, a backward difference formula for the last data point, and a central difference formula for all other data points.
(a) Write a Matlab function which implements the above algorithm to estimate the derivative of a function described by a set of data points. Your function should accept two inputs:
- the first input is an N-element vector containing the measured values of the function (the fks)
- the second input is the spacing between data points ( x ? )
Your function should return an N-element vector containing the estimated derivative of the function. The size of the vectors should be determined by your function. Your function does not need to do any error checking on the inputs.
(b) Write a script file which uses the function you created in part (a) to calculate and plot the derivative of the function )x sin( )x(f π 2 = , for 1 0 ≤ ≤ x . Your script file should do the following:
i. Create data points for f(x) and use your function to estimate its derivative with x ? =0.1
ii. Create data points for f(x) and use your function to estimate its derivative with x ? =0.01
iii. Calculate the exact value of the derivative of f(x) for 1 0 ≤ ≤ x at increments of x ? =0.01
iv. Plot the above three sets of data on a single figure. Include a legend to indicate which line corresponds to which case, and label the vertical and horizontal axes appropriately.