Illustrations of variable number of output arguments, MATLAB in Mathematics

Assignment Help:

Illustrations of Variable number of output arguments:

In the illustrations shown here, the user should actually know the type of the argument in order to establish how many variables to have on the left-hand side of the assignment statement. An error will answer if there are too many variables.

>> [arrtype, r,c] = typesize(4:6)

??? Error using ==> typesize

Too many output arguments.

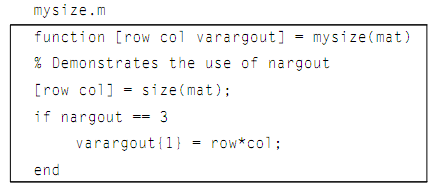
The function nargout can be called to establish how many output arguments were used to call a function. For illustration, in the function mysize, later, a matrix is passed to the function. The functions behave like a built-in function size in that it returns the number of rows & columns. However, if three variables are used to store the answer of calling this function, then it also returns the total number of elements:

163_Illustrations of Variable number of output arguments.png

>> [r c] = mysize(eye(3))

r =

3

c =

3

>> [r c elem] = mysize(eye(3))

r =

3

c =

3

elem =

9

Note that the nargout does not return the number of output arguments in the function header, but returns the number of output arguments expected from the function (example, the number of arguments in the vector in the left-hand side of the assignment statement whenever calling the function). In a first call to the mysize function, the value of nargout be 2, therefore the function returned only the output arguments row and col. In the second call, as there were three variables on the left of the assignment statement, the value of nargout be 3, therefore the function also returned the total number of elements.


Related Discussions:- Illustrations of variable number of output arguments

Find minimum and maximum for each row, Find Minimum and Maximum for each ro...

Find Minimum and Maximum for each row To find the maximum (or minimum) for each row, the dimension of 2 (that is how a MATLAB refers to rows) can be identified as the third arg

Plot types - plot functions, Plot types: Besides plot and bar, there a...

Plot types: Besides plot and bar, there are another plot types like stem plots, histograms, stem plots, area plots and pie charts, and also other functions which customize the

Print an imaginary number, Print an imaginary number: To print an imag...

Print an imaginary number: To print an imaginary number, the function disp will show both parts automatically: >> disp(z1)    4.0000 + 2.0000i The function fprint

Built in recursive function in matlab, Built in recursive function in MATLA...

Built in recursive function in MATLAB: We have seen that the built-in function in MATLAB to compute factorials, termed as the factorial and we know how to implement the iterat

Illustrations of variable number of output arguments, Illustrations of Vari...

Illustrations of Variable number of output arguments: In the illustrations shown here, the user should actually know the type of the argument in order to establish how many va

Functions to create special matrices, Functions to create special matrices:...

Functions to create special matrices: The MATLAB also has various functions which create special matrices. For illustration, the zeros function generates a matrix of all zeros

Illustration of logical vectors, Illustration of Logical vectors: Call...

Illustration of Logical vectors: Calling the function appears to return similar vector as simply vec > 5, and summing the result still works to determine how many elements wer

Symbolic expression, Symbolic Expression The solve function solves an e...

Symbolic Expression The solve function solves an equation and returns the solution(s) as symbolic expressions. The answer can be converted to numbers by using any numeric funct

Empty vectors, Empty Vectors: An empty vector or in another words, a v...

Empty Vectors: An empty vector or in another words, a vector which stores no values, can be generated using the empty square brackets: >> evec = [] evec = [] >> lengt

Pie chart - plot functions, Pie chart - plot functions: The MATLAB als...

Pie chart - plot functions: The MATLAB also has a function pie which will generate a pie chart. Calling the function with the form pie (vec) draws a pie chart, by using the pe

Write Your Message!

Captcha
Free Assignment Quote

Assured A++ Grade

Get guaranteed satisfaction & time on delivery in every assignment order you paid with us! We ensure premium quality solution document along with free turntin report!

All rights reserved! Copyrights ©2019-2020 ExpertsMind IT Educational Pvt Ltd