Calculate the theoretical mean value for signal, Electrical Engineering

Assignment Help:

In most real signal processing applications the measured signals can not be described by an analytical expression. In addition, by the Wold decomposition theorem a stationary signal can be represented as a sum of its predictable part and its stochastic part. Here, we focus on stochastic signals. Real signals are generally random (stochastic) in nature and therefore, it is only possible to de?ne their statistical properties. A simple discrete random signal may be generated from within MATLAB with the rand function (generates a zero-mean white Gaussian noise signal).

a) Generate a length 1000 discrete random signal x, a bold font is used to emphasise that it is a random signal, and display the result with the stem function.

Observe that although this signal can clearly not be represented by an analytical expression, there is a degree of uniformity along its length, i.e. thestatistical properties of the signal are not time-varying. Such a signal is said to be statistically stationary.

- Use the MATLAB documentation to discover more about the rand function and how it generates random numbers.

- Calculate the theoretical mean value for this signal; this quantity can be estimated from x with

2348_Calculate the theoretical mean value for this signal.png

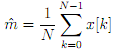
where m' is the so-called sample mean, the circum?ex denotes that the quantity is an estimate.

- Use the mean function within MATLAB to perform this calculation for x. How accurate is this estimate?

- Calculate the standard deviation for this signal; estimate this quantity with the std function which is based upon and

401_Calculate the theoretical mean value for this signal1.png

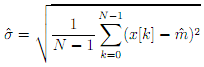
is referred to as the standard deviation.

- Use the rand function to generate, in turn, nine more length 1000 random signals and calculate sample mean and standard deviations
for each signal. Plot the sample mean and standard deviations values for the ten signals and show they cluster about the true values.

What can you say about the bias of these estimators?

The mean and standard deviation are two quantities which describe the statistical properties of a statistically stationary random signal.
To obtain a complete statistical description of the signal it is necessary to examine the probability density function from which each time
sample is drawn.

- Use the hist function to approximate the probability density function for one of the length 1000 x signals (The true probability density function would be obtained if the output from hist was scaled by the number of points in x). Comment upon the result, in particular, what function will it converge to as the length of x becomes very large?


Related Discussions:- Calculate the theoretical mean value for signal

Find the antenna temperature, Q. If an antenna has an available noise power...

Q. If an antenna has an available noise power of 1.6 × 10 -15 W in a 1-MHz bandwidth, find the antenna temperature.

Electronics, why inductive load is use in electronics circuit?

why inductive load is use in electronics circuit?

Name the different methods used for data transmission, What are the differe...

What are the different types of methods used for data transmission? The data transmission among two points involves unidirectional or bi-directional transmission of meaningful

Explain the different types of polarizations, Explain the different types o...

Explain the different types of polarizations. Polarizations are of three types. i. Electric polarization ii. Ionic polarization. iii. Dipolar polarization.

Determine the stations visual-carrier frequency, If a television station op...

If a television station operates on UHF channel 20 (band 506-512 MHz), determine the station's visual-carrier frequency.

What is key bouncing, What is Key bouncing? Mechanical switches are us...

What is Key bouncing? Mechanical switches are used as keys in lots of the keyboards. When a key is pressed the contact bounce back and forth and settle down only after a littl

Linear and position invariant, Q. Linear and position invariant? Assume...

Q. Linear and position invariant? Assume that the model illustrated below is linear and position invariant. Also the noise and the image are uncorrelated. Show that the powe

Discuss important properties and uses of rubber, Discuss important properti...

Discuss important properties and uses of Rubber. Rubber: It is polymeric material along with high elastic yield strain. The various types of rubber materials are given as-

Explain classification of amplifiers on biasing conditions, Q. Explain the ...

Q. Explain the classification of amplifiers on the biasing conditions? Based on the amount of transistor bias and amplitude of the input signal, amplifiers can be classified as

Write Your Message!

Captcha
Free Assignment Quote

Assured A++ Grade

Get guaranteed satisfaction & time on delivery in every assignment order you paid with us! We ensure premium quality solution document along with free turntin report!

All rights reserved! Copyrights ©2019-2020 ExpertsMind IT Educational Pvt Ltd