Reference no: EM131438844
Detailed Data Plan (due March 26)
Based on this week's live session, here's what I think that the professor expects us to include in our detailed data plan. To make things easier, we'll stick with the same topics throughout the entire project, so try to sign up for something that you find interesting! There's also a proposed timetable and a signup sheet at the bottom.
Project Manager
? Compile, revise, and format everything
? Write the introduction/conclusion sections
? Coordinate efforts for each section of the project
Slice & Dice
? Identify the irrelevant variables, a plan to remove them, and an explanation of why we don't want them in the final data set
? Provide a short description of the tools to be used for this purpose (Excel, Excel for Analysis are required) and how they will be used
? Provide a brief summary of what the final dataset set should look like and what variables it will include
The first step in cleaning in our dataset is to organize our Excel file into three sheets: original data, working data, and final data. We will use the working data sheet to analyze and clean up the data while leaving the original data untouched. This will enable us to clean up the dataset, while still maintaining the integrity of the original dataset as a reference point to validate our final dataset.
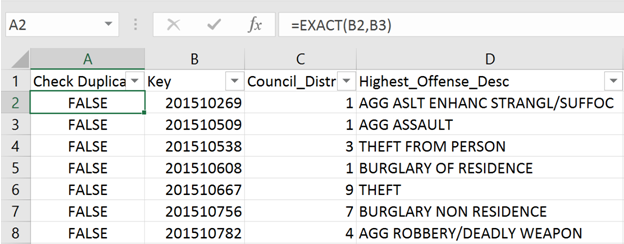
Our dataset already has an identifier column named "key." We will use this key to ensure our dataset does not have duplicate values. We will sort the data by the "key" column, and then add a new column using the "EXACT" function available in Excel to test if the key from the current row and the following row is the same (Figure 1). If it is, the value of the function should return true, and we will remove that row.
Next we will apply the appropriate formatting to each column and remove any characters that would impede our analysis. For example, we will remove any text such as $ and % in our numerical columns by doing a find and replace, and instead format the column as currency or as a percentage. This will allow us to treat those column as numerical values rather than text.
Now that we've completed our initial formatting and validation, we will move on to removing any null records and duplicative or irrelevant attributes. Because we combined two data sets, we ended up with some records that could not be joined which left us with some records that would be considered incomplete for the purposes of our analysis. To remove those records, we will filter the dataset by the zip code key we used to join the records. Where that key is null, we will remove the entire record. There were a total of 160 records that met this criteria.
To determine irrelevant or duplicative fields we will use Microsoft Excel's Analysis ToolPak and manual review. From a manual review perspective, we were able to determine that we should remove one of the zip code fields since that is the field we used to join the data together and were therefore duplicates of one another. Secondly, since we have the address location and the X and Y coordinates, we removed the location as the we can ascertain the location from the coordinates if desired.
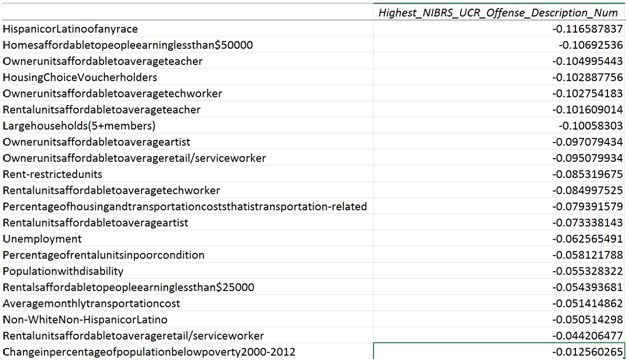
To determine if our numerical attributes are related to our categorical attribute of the type of crime, we first need to convert our crime category to a number. We can do this using a vlookup. Once we've converted our crime category to a number, we can use the Analysis ToolPak to run a correlation analysis. Using this information we can see which variables have very little correlation to crime, and remove it from our larger analysis (Figure 2).
Columns Removed
|
Column Name
|
Reasoning
|
|
Zip_Code_Housing
|
Duplicate column to Zip_Code_Crime
|
|
Location
|
Also have X, Y coordinates which can be used to ascertain the location, but also provide more analysis capabilities than a text based address
|
|
Rentalunitsaffordabletoaverageretail/serviceworker
|
Low correlation to main categorical variable of crime: -.04
|
|
Changeinpercentageofpopulationbelowpoverty2000-2012
|
Low correlation to main categorical variable of crime: -.01
|
|
ercentageofhomeswithin1/4-mioftransitstop
|
Low correlation to main categorical variable of crime: -.01
|
|
Changeinmedianhomevalue2000-2012
|
Low correlation to main categorical variable of crime: .01
|
Columns Added
|
Column Name
|
Reasoning
|
|
Report_Clearance_Days_Diff
|
Additional analysis point based on length of time in days between the time the crime was reported and the time the investigation was marked as completed
|
The resulting final data set has been modified to remove null records and numerical variables with low correlation to our main categorical variable. Additionally, duplicative attributes such as location and zip code have been removed. We have also decided to add a column that is the difference in days between the date the crime was reported, and the date the crime was marked as investigation completed. The resulting data set will allow us to perform analysis on the types of crimes, their location, date, and impacting demographic information. We can also perform analysis on the types of crimes that are solved, the time between solving them, and if any of our demographic or location data impacts those rates.
Visualizations
? Describe the specific visualizations that we intend to use
? Provide a short description of the tools to be used for this purpose and how they will be used (Lumira is required)
Since attempting to analyze large datasets by viewing the rows and columns of an Excel sheet would be an impossible task, we will utilize some of the tools available to visually provide any correlations that may be present between our crime and demographic information. With the task of slicing and dicing completed, we will be able to analyze our dataset to determine which actionable items will be valuable for visualizations. For the creation of our visualizations, we initially plan to utilize Excel and the Lumira module of SAP Business Objects.
To provide analysis for data with a small number of variables, we will utilize the pivot tables and charts available within Excel. These visualizations are able to provide a quick overview of our data when we are looking to only compare two or three variables on a linear scale. An example of this simple data analysis would be determining any trends in the number of crimes reported for each month throughout the year (Figure ()).
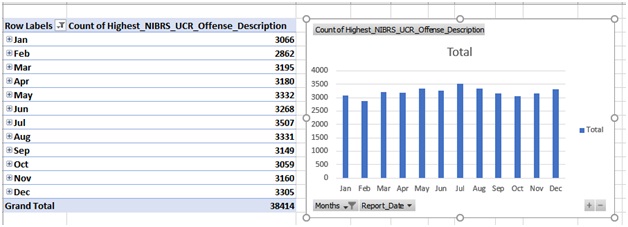
Figure ()
As our dataset contains over 39,000 rows and 37 columns, analyzing the plethora of crime data to the many different demographics for possible correlations cannot be achieved through the use of pivot tables and charts alone. When we will be considering analyzing multiple actionable items, we will utilize the Lumira module within SAP BusinessObjects Predictive Analytics. Lumira has several visualization styles available to allow us to convey the information we discover in a clear manner. We will take advantage of the location data within the dataset, such as zip code, council district, and coordinates, to create geo-based maps to show what areas of the city may need increased patrols to combat crime. We will also be utilizing heat maps to analyze the numerous variables within our dataset to further assist in identifying any correlation between crime statistics and city demographics, as shown Figure ().
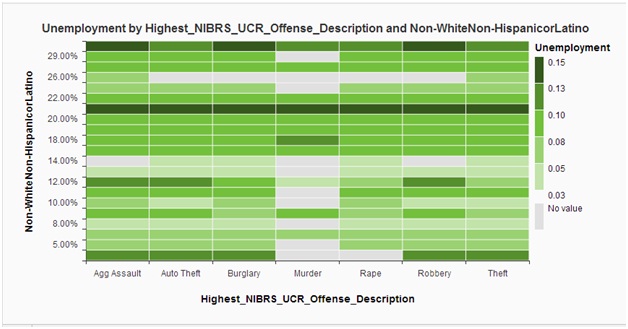
Figure ()
Dashboard
? Describe how the dashboard will integrate all of our visualizations
? Identify the interactive features of the dashboard, and how they will help illustrate the data in a meaningful way
? Provide a short description of the tools to be used for this purpose and how they will be used (Design Studio is required)
Predictive Analytics
? Outline the actionable information that we potentially think we will be able to extract from the data, and why this information would be important to the city government and law enforcement
? Provide a short description of the tools to be used for this purpose and how they will be used (SAP Predictive Analytics is required)
Proposed Timetable
? Rough drafts by Sunday, March 19
? Team meeting after the live session on Monday, March 20 to discuss revisions
? Final drafts by Friday, March 24
? Submission sometime before Sunday, March 26
Section Signups
|
Role
|
Team Member
|
|
Project Manager
|
A. Ryan Dy
|
|
Slice & Dice
|
Aaron Bittig
|
|
Visualizations
|
Craig Prest
|
|
Dashboard
|
Olive Bassey
|
|
Predictive Analytics
|
Dashiel Lopez Mendez
|
A few paragraghs, not an essay. This section is regarding the project my classmates and I are working on so please read the whole document first.Dashboard
-
Describe how the dashboard will integrate all of our visualizations
-
Identify the interactive features of the dashboard, and how they will help illustrate the data in a meaningful way
-
Provide a short description of the tools to be used for this purpose and how they will be used (Design Studio is required)