Reference no: EM13398
Question 1
The subsequent set of data is the mark for 30 students in a final exam.

(a) Use SPSS commands: Analyze -> Descriptive Statistics -> Explore to:
(i) Prepare descriptive statistics.
(ii) prepare a stem-and-leaf plot of the data.
(iii) prepare a box plot of the data.
(b) Briefly comment on what the plots reveal.
Question 2
The literary styles of different authors will vary widely. In particular, one factor that can differ is the word length of sentences. Using either a library or your own bookshelf, select two (fiction) novels of a reasonable length, written in English and by two different authors.
For each of the chosen sentences record the measurements on the following variables:
Page Number: the page number that the sentence appeared on.
Number Words: the number of words in the sentence.
Number Letters: the number of letters in the sentence.
Repeat this process for your second novel. Do not list the data in your assignment solutions yet - this will be done in (e).
(c) Enter the data collected in (b) into an Excel spreadsheet. You will need two separate tables - one for each novel. Each table should be titled with the name and author of the novel and include all data collected for each sentence. Do not print out the spreadsheets yet.
(d) On your spreadsheet, add two new variables: Word Length - the average number of letters per word, and Word Density - a variable that classifies sentences as either "Low", "Medium" or "High" density depending on whether they have an average word length of less than 4.0 letters, at least 4.0 letters but less than 5.0 letters, or at least 5.0 letters respectively. Add the values of the new variables to your table for each question. Do not print out the spreadsheets yet.
(e) Following the guidelines for tabular presentation, redraw the above tables. Assume that we are primarily interested in the columns Word Length and Word Density.
Notes: Do not round the measurements for Page Number, Number Words and Number Letters. You MUST use Excel to draw the table.
(f) By hand, draw side-by-side dot plots of the word lengths for the two novels.
(g) Using your answers for (f), in plain English, compare the word lengths of the two novels.
(h) Either using Excel or SPSS, use an appropriate exploratory tool to display the relationship between the variables Word Length and Number Words for your second novel. Comment on what this display shows.
Question 3
The Roller Coaster Database is a website that contains a database of all the roller coasters in the world. Information on steel tracked roller coasters was taken from the latest census of operating roller coasters. Coasters were classified by the region they were in and the type - Inverted, sit-down or other (which included pipeline, bobsled, flying, stand-up, suspended and 4th dimension coasters).
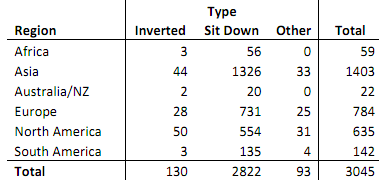
Use the table to answer the following questions about these roller coasters.
(a) What proportion of steel tracked roller coasters are in Asia?
(b) What region has the highest proportion of inverted steel tracked roller coasters?
(c) Given that a steel tracked roller coaster is in Europe, what is the probability that it is sit down?
(d) What proportion of European steel tracked roller coasters are sit down?
(e) Of all sit down steel tracked roller coasters, what proportion are in Europe