Fit the exponential function to the relaxation data

Assignment Help MATLAB Programming
Reference no: EM1384187

A group of students have collected mechanical data (on a MTS machine) from chicken cartilage.  Specifically, they have collected data during a stress-relaxation test from 3 samples of femoral and 3 samples of tibial cartilage, and have generated data seen in the figure below.

1270_Fit the exponential function to the relaxation data.png

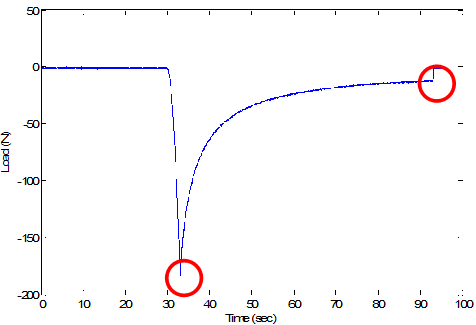
            Their cruel, some might say evil, instructor has asked them to determine if the femoral and tibial cartilage are significantly different by analyzing the data with the following exponential equation.

                        L(t) = A e-t/T +B

Where L is the load (y-axis), t is time (x-axis) and A, tau and B are parameters that describe the relaxation.  To finish their analysis, students will have to determine A, tau, and B for each specimen tested (3 femur + 3 tibia).

Your assignment is to write MATLAB code which will allow these poor helpless students to complete their assignments, by using the lsqcurvefit function.

Specifically you will be create 3 functions and 1 script which will:

1. read in the .dat file (including the header information, you already have this code!), with the added feature of being able to load in a 2nd file but remembering previous file's location.

2. plot load (y-axis) versus time (x-axis), and 'remove' prior to reading the minimum, and 60 seconds AFTER reaching the minimum load.

3. Fit the exponential function to the relaxation data and report the filename as well as the A, tau and B values.

4. Run all 3 functions in sequence to analyze ALL data

function_name - denotes a MATLAB function

PSEUDO-CODE functions:

1. ca02_fun1.m: [data import] - reads data from file, plots result

1.1. INPUT:  .dat file name [1xNs string array]

1.2. OUTPUT:  data [Ndx3 numeric array], c_labels [1x3 cell array], filename [1xNs]

1.3. look for figure with 'tag' 'relax-test'

1.4. if does not exist, create it, set 'tag' to 'relax-fit', set 'filename' to '*.dat'

1.5. use nargin, if < 1,

1.6. get old file name from 'filename' field

1.7. prompt user for file (uigetfile)

1.8. create new filename

1.9. set 'filename' to dat_filename for figure

1.10. call new function read_datfile

1.11. plot time (x-axis) vs load (y-axis)

1.12. label axes

2. ca02_fun2.m: [data processing/visualization] - find minimum point, and separate relaxation data

2.1. INPUT:  data (Ndx3 matrix)

2.2. OUTPUT:  data_realx (Nrx3 matrix)

2.3. find row with minimum load value (min)

2.4. determine time at for this row (t_start)

2.5. find last row at t_start + 60;

2.6. create a vector of rows from beginning to end of relaxation data

2.7. export only those rows as variable data_relax

2.8. overlay plot of just the relaxation data

3. ca02_fun3.m:  [least square curve fit] - fit an equation to the data and determine the parameters of the exponential

3.1. INPUT: data_relax [Nx3 numeric matrix]

3.2. OUTPUT:  fit_parameters [1x3 array]

3.3. lookfor object with 'tag' 'relax-fit' (findobj)

3.4. if you can't find it, create the figure with that 'tag'

3.5. make time your x-data (first remove the initial time point)

3.6. make -1*load your y-data

3.7. create inline exponential function 'x(1)*exp(-x_data/x(2))+x(3)','x','x_data'  (this is the function you will be 'fitting'.

3.8. plot time (x-axis) versus load (y-axis)

3.9. initialize x values

3.10. set lower limits

3.11. set upper limits

3.12. run lsqcurvefit get x_fit (fit parameters)

3.13. create an estimate of your y values based on x_fit

3.14. display output in work space (disp)

4. ca02_script.m:  [script to run all programs] - this script combines all programs so you can easily analyze many files.

4.1. Outputs from ca02_fun1, are inputs to ca02_fun2

4.2. outputs from ca02_fun2 are inputs for ca02_fun3

4.3. create a 'formatted' output txt with the following fields

4.4. 'filename (stripped of path), A, tau, B

Reference no: EM1384187

Questions Cloud

What is meant by sociological perspective : Write down a 700 to 1000 word paper which explains what is meant by the sociological perspective. Describe how it helps us to understand the origins of crime and to identify possible ways of reducing crime.
Cycles to maximize the roi on building new hotels : As CEO, would you try to predict the cycles to maximize the ROI on building new hotels? It takes 2-3 years to build a hotel and another 5-10 to begin earning an ROI.
Write challenges with requirement elicitation : What is meant by "enterprise-wide analytics technology," and how can it play part in understanding business processes? Write down the challenges related with "requirement elicitation"
Create application to read file containing same product id : Create the application which reads the file of inventory information comprising product ID and quantity. File can contain numerous entries for same Product ID.
Fit the exponential function to the relaxation data : Fit the exponential function to the relaxation data and report the filename as well as the A, tau and B values and run all 3 functions in sequence to analyze ALL data
Outlasts even the best economic cycles : begin earning an ROI. Combined, that is 7-13 years which outlasts even the best economic cycles. How would you treat that reality
Albino locus to an albino mouse heterozygous : In mice, the A y  allele of agouti mice is ecessive lethal allele, but it is dominant for yellow coat color. What phenotypes and ratios of offspring would you expect from the cross of a mouse
Discuss the many costs that businesses face today : Discuss the many costs that businesses face today. Is it always practical to test new ideas via a 'real life' study - with participants, facilities, etc? If not, how can a simulation be utilized to test ideas while keeping costs manageable?
Compute the water content : A small chunk of the original sample had a wet weight of 140.9 grams and weighed 85.2 grams after drying. Compute the water content, using the correct number of significant figures.

Reviews

Write a Review


MATLAB Programming Questions & Answers

  Symmetry in the rod

matlab programming

  Find the integral of a function at an arbitrary location

Write a Matlab function to perform numerical integration of a set of evenly spaced data points using the trapezoidal rule

  Calculate an approximation to the energy consumed

Calculate an approximation to the energy consumed over the period and calculate an approximation to the energy consumed over the period t = a to t = b.

  Determine the optimal linear predictor

Determine the optimal linear predictor for a given order N and DPCM simulation and write a graphical user interface that has least the following functions

  Z-transform in matlab

Z-Transform in MATLAB, Sketch the z-plane pole-zero plot and determine the stability status for the following digital system. Determine the h(n) in MatLab.

  Filtering – biomedical application

Prepare a filter that removes noise produced by electronic medical equipment.

  Time domain design and analysis

To design a "custom" controller to reduce the vibrations of the seat and a PID controller to reduce the vibration of the seat

  Plot way forms for the subsequent modulation schemes

Plot way forms for the subsequent modulation schemes using Matlab

  Finds the value of a using a numerical method

Finds the value of a using a numerical method

  Matlab code to solve for temperature and pressure variation

Write down the MATLAB code to solve for temperature and pressure variation throughout the expansion process and to evaluate work and heat produced in processes for variable values of n.

  Write a program to compute a

Write a program to compute A. Test it with P = $55,000 and interest rate of 6.6% (i = 0.066). Compute results for n = 1, 2, 3, 4, and 5 and display the results as a table with headings and columns for n and A

  Develop a well-structured function

Develop a well-structured function to compute v as a function of t. Then use this function to generate a table of v versus t for t = -5 to 50 at increments of 0.5.

Free Assignment Quote

Assured A++ Grade

Get guaranteed satisfaction & time on delivery in every assignment order you paid with us! We ensure premium quality solution document along with free turntin report!

All rights reserved! Copyrights ©2019-2020 ExpertsMind IT Educational Pvt Ltd