Thermogravimatic Curves:
So far we have discussed the instauration of TG now we turn our attention to quantitative aspects of TG. As elaborates previously TG curves represent the differences in the mass (m) of the sample along with the temperature (T) or time (t). Generally, we plot mass loss downward on the ordinate (y) axis and mass gain upwards as shown in Figure.
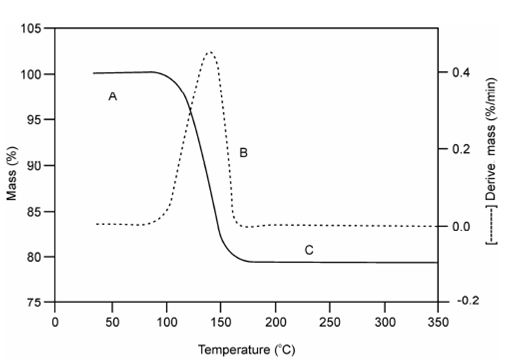
Figure: TG Curve. Note the plateau of constant weight (region A), the mass loss portion (region B), and another plateau of constant mass (region C)
Sometime we also record derivative thermogravimetric (DTG) Curves. A DTG curve presents a rate of mass change (dm/dt) as a function of temperature, or time (t) against T on the abscissa (x axis) as displays in Figure while substance is heated at uniform rate. Within this figure, the derivatives of the Curve are displays through dotted lines.