Typical Example of the Sieve Analysis:
In Column 3 of the table, the percentage weight retained on each sieve is calculated as below. It denotes the percentage of that particular fraction present in the aggregate sample. For an exacting sieve size, say Sx,
% weight retained on the sieve Sx = Weight retained on the sieve Sx/ Total weight of the aggregate sample × 100
For example, percentage weight retained on 2.36 mm sieve is computed as below
= (120/1000) × 100 = 12%.
Table: Typical Example of the Sieve Analysis
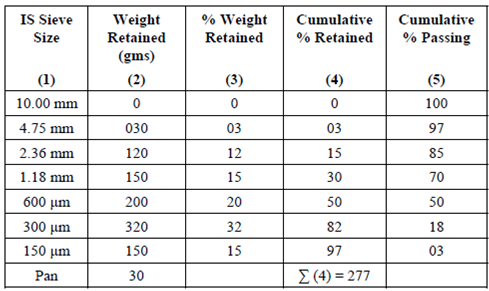
In Column 4 of the table, the cumulative percentage retained on each sieve is calculated, which, for sieve Sx, will be equal to the cumulative sum of the percentage weight retained on each sieve (given in Column 3) above and including that on the sieve Sx. A cumulative percentage retained on the sieve Sx indicates that this much percentage of particles in that sample of aggregate is coarser than sieve size Sx. For instance, cumulative percentage retained on 2.36 mm sieve will be 3 + 12 = 15 %. It implies that 15 % of particles in the given sample of aggregate are coarser than 2.36 mm.
In Column 5 of the table, the cumulative percentage passing on each sieve is obtained (100 - cumulative percentage retained.) The cumulative percentage passing through the sieve Sx indicates that this much percentage of particles in that sample of aggregate is finer than sieve size Sx. For example, cumulative percentage passing from 2.36 mm sieve will be 100 - 15 = 85%. It indicates that 85% of particles in the given sample of aggregate are finer than 2.36 mm.
Comments
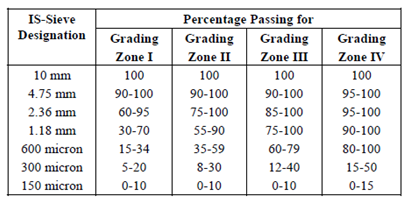
The observations of the sieve analysis, put in tabular form, are used for drawing the grading curve, describing the grading of aggregate and for determining the fineness modulus as explained in subsequent paragraphs. Also, by comparing the results of sieve analysis of fine aggregates with the standard table given in IS 383: 1970 (reproduced in Table 3) the zones of sand (I, II, III or IV) can be identified. The Zone I indicates coarse sand and Zone IV represents fine sand. This data is useful in performing the concrete mix design. It is recommended which use of the fine aggregates, conforming to Zone IV, should be avoided in reinforced concrete unless the suitability of using such aggregates is ascertained through tests.
Table: Grading Limits for Fine Aggregates