Growth of bacteria in liquid culture
When Bacteria are grown in their planktonic form as free-living organisms in a liquid medium and not attached to any surface they will divide in a regular manner until one growth factor runs out. The limiting growth factor may be the carbon source, energy source or one of any number of micronutrients. As Bacteria and Archaea grow through a process of binary fission, at the end of a complete round of cell division there will be twice as many cells compared with the beginning of growth. If we consider a single cell after division this becomes two cells those two cells become four and so on in other words:
1->2->4->16->32
This could be expressed mathematically as 2 to the power of n where n is the number of times the cell has divided.
21->22->23->24->25->26
Using a method to determine the number of cells at any time during the growth of the culture and then the number of cells after n rounds of cell division this becomes:
N = N02n.
The equation can be rearranged to be more useful in the lab to:
n = 3.3(log N - log N0)
This is not such a useful equation as such because it is difficult to count micron-sized Bacteria into a pot. Fortunately, it is easy to measure the numbers of cells in solution using a spectrophotometer. The spectrophotometer is normally set to read light at wave- lengths between 500 and 600 nm – the actual figure used depending on the species being examined. As the spectrophotometer measures the amount of light scattering in a solution the optical density the more the scattering the higher the OD the readings obtained reflect the number of bacteria in solution. If the OD/number of cells is plotted against time a graph is produced similar to the one in Figure 2.
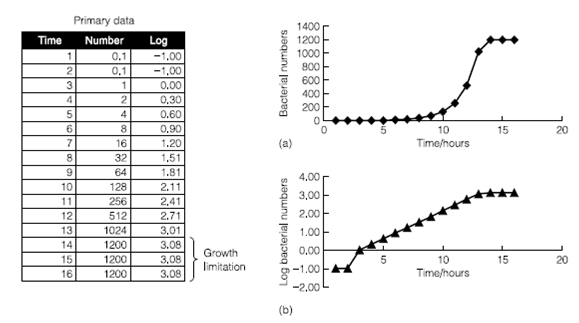
Figure 2. The relationship between cell number and time is exponential.
A curve using the primary cell number data is exponential for most of the curve reflecting N = N0 2n. Exponential curves are hard to compare so to make better sense of how the organism is growing a more useful plot is the log OD versus time. This now means that most of the curve is a straight line the slope of which is the specific growth rate m. So for an organism grown under defined conditions temperature, growth substrate, etc. the specific growth rate can be defined as:
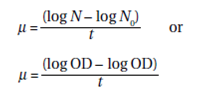
It is not always convenient to plot a complete graph of the growth of an organism, so growth rate is sometimes expressed as doubling time. The doubling time td of a culture is the time it takes for the OD to double i.e. the cell numbers to multiply by two.
td = t2N - t0
The doubling time of Escherichia coli is around 20 minutes when it is growing under optimal conditions but the doubling time of some organisms can be relatively large – the planctomycete used in the Anammox process has a doubling time in excess of 3 weeks.
Since OD is related to the number of particles in solution but not directly to concentration, it is thus a colligative property. If two species have different cell volumes, this means that for the same OD reading the grams biomass per ml may be different. It is possible to make a direct estimation of biomass by either taking samples and measuring the dry weight of the culture or measuring total protein or total carbon. Although these methods are accurate none of them are rapid so a compromise is to establish the relationship among OD and dry weight once then extrapolate to other OD readings.