Cartesian coordinate system:
The Cartesian Coordinate System which is also known as the rectangular coordinate system, consists of two number scales, known as the x-axis (at y = 0) and the y-axis (at x = 0), which are perpendicular to each other. Every scale is a number line drawn to intersect the other at zero. The zero point is known as the origin. The divisions along the scales may be any size, but each division must be equal. Below figure shows a rectangular coordinate system. The axes divide and the coordinate system into four regions known as quadrants. Quadrant I is the region above the x-axis and to the right of the y-axis. The region above the x-axis is Quadrant II and to the left of the y-axis. The region below the x-axis and to the left of the y-axis is Quadrant III. Quadrant IV is the region below the x-axis and to the right of the y-axis.
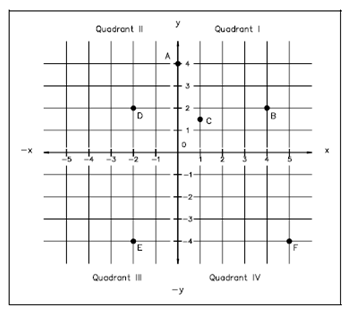
Figure: The Cartesian System
The use of a graph begins with the plotting of data points using the coordinate system. These data points are called as the abscissa and the ordinate. The abscissa that is also known as the y-coordinate is the distance along the y-axis. The ordinate that is also called as the x-coordinate is the distance with the x-axis. A point on a Cartesian coordinate graph is particular through giving its x-coordinate and it's y-coordinate. Positive values of the x-coordinate are measured to the right and negative values to the left side. Positive values of the y-coordinate are measured up and negative values down. For instance, the x- and y-coordinates are both zero at the origin. The origin is indicates as (0, 0), where the first zero refers to the value of the x-coordinate. Point A in Figure is indicates as (0,4), since the value of the x-coordinate is zero, & the value of the y-coordinate is 4. In Quadrant I, each point has a positive x-coordinate and a positive y-coordinate. Point B in Figure is located in Quadrant I and is indicated by (4,2). Fractional values of coordinates can also be display. Point C in Figure 1 is indicated by (1,1.5). In Quadrant II, every point has a negative x-coordinate and a positive y-coordinate. Point D is indicated by (-2,2). In Quadrant III, every point has a negative x-coordinate and a negative y-coordinate. Point E is located in Quadrant III and is indicated by (-2,-4). In Quadrant IV, each point has a positive x-coordinate, but a negative y-coordinate. The point F is located in Quadrant IV and is indicated through (5,-4).