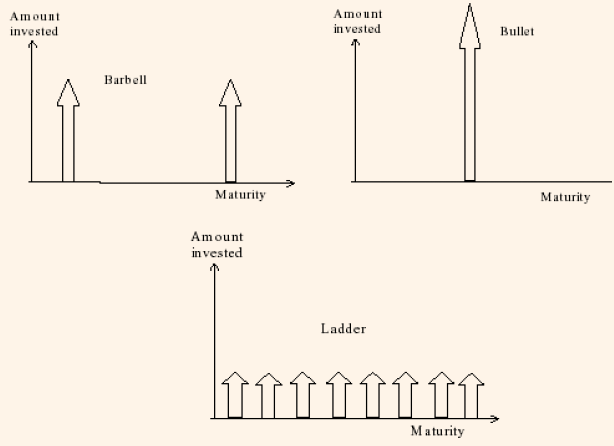
Yield curve strategies take into account the distribution of the maturities of the bonds of the portfolio in order to take advantage of the forecasted movements of the yield curve.
The effect of the maturity structure of the portfolio can have a remarkable impact on its total return when the yield curve changes its level as well as shape. For example, when a significant shift occurs in the yield, the total return of a portfolio that includes a single bond with 5 years duration will be very different to the portfolio consisting of two bonds (first bond duration is one year and second bond duration is nine years) with similar duration. This happens as result of convexity. Convexity ensures that the two bond portfolio known as 'maturity barbell' will outperform the one bond portfolio called as 'bullet', even when the single bond is callable.
The yield curve strategies are classified into three types, namely,
-
Bullet strategies.
-
Barbell strategies.
-
Ladder strategies.
In a bullet strategy, the portfolio consists of bonds that are based on a single maturity, whereas in a barbell strategy, the bonds in the portfolio can have either very short or very long maturities. Ladder strategies (maturity spacing or laddering) or staggered maturities approach implies spacing the maturities in a fixed income portfolio. For example, if the investment horizon is taken as 12 years, maturity spacing means investing 12 percent of the portfolio so that it matures annually for 12 years. Subsequently, when the first bond matures, it is again invested in a new 12-year bond and so on.
Maturity spacing can be said as a kind of passive portfolio management approach and as such does not require any forecast of future movements of interest rates. Thus, with this strategy, the investors will have bonds maturing in any market conditions. This strategy minimizes the risk of wrong maturity in the wrong stage of the interest rate cycle because of even distribution of maturities in the portfolio. Further, the concept of maturity spacing minimizes the risk of reinvestment with regard to relative small amount that has to be reinvested in any period.
For example, suppose an investor wants to invest 3,000,000 USD in a bond portfolio. The portfolio manager advises the investor to invest equal dollar amounts at regular intervals along the yield curve. Assume that he purchases ten bonds each with 3,000,000 USD face value (10% of 3,000,000), maturing annually for 10 consecutive years. After some time the first bond matures, and he invests in another ten-year bond, and continues the cycle. This approach implies that he never concentrated in one maturity, which reduces the re-investment risk.
Forecasted movements include shift, twist and butterfly. A shift implies a parallel shift of the yield curve; a twist refers to a change in the slope of the yield curve; Finally, a butterfly refers a situation where in the short end and the long end of the yield curve move in the same direction as each other, however at a different rate of change than the middle maturities of the curve.
The ladder strategy in comparison to bullet strategy and barbell strategy is shown in the following figure:
Figure 1: Bullet, Barbell and Ladder Strategies