Treasury yield curve, Financial Management

Assignment Help:

Treasury securities are government bonds issued by the US Treasury Department. These are issued through the Bureau of the Public Debt. They are debt-financing instruments of the US Federal government. These securities are of four types - Treasury Bills, Treasury Bonds, Treasury Notes and Savings Bonds. All these securities, except savings bonds are highly liquid and heavily traded in the secondary stock markets.

In treasury securities, there exist on-the-run treasury securities and off-the-run treasury securities. The on-the-run treasury securities are the most recently issued US Treasury bonds and notes. Normally, stockbrokers acquire these securities in large quantities and sell them to retail investors. These securities are highly liquid and are traded at higher prices when compared to that of off-the-run treasury securities. Off-the-run treasury securities are those treasury securities, which are issued, in earlier auctions.

These securities are fixed income instruments and are free from credit risk. These securities provide low yield when compared to that of non-treasury securities. This is due to their favorable tax treatment, high liquidity, being free from credit risk, and being non-callable securities.

The relationship between the yields offered on the treasury securities for each maturity when represented graphically is refereed to as treasury yield curve. A yield curve may be an upward sloping yield curve (longer the maturity, higher the yield), inverted yield curve (longer the maturity, lower the yield), or a flat yield curve (same yield regardless of maturity).

Figure 1: US Treasury Yield Curve
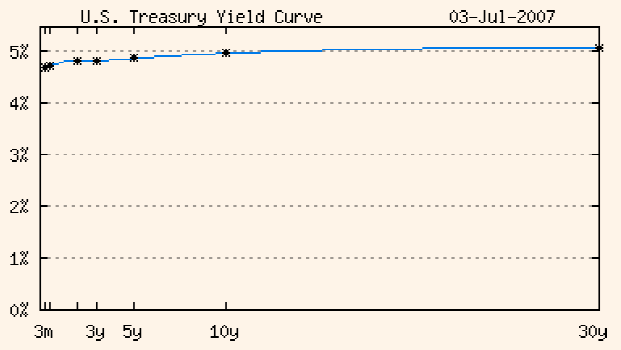
 

1523_us treasury yield curv.png

Table 1

Maturity

Yield on 03.07.2007

Yield on 02.07.2007

3 Month

4.71

4.65

6 Month

4.74

4.71

2 Year

4.83

4.85

3 Year

4.83

4.87

5 Year

4.87

4.91

10 Year

4.97

5.01

30 Year

5.07

5.10

 From the above two exhibits, it is clear that the longer the maturity, the higher will be the yield. Due to this feature, treasury yield curve is also known as the 'upward sloping yield curve' or the 'normal yield curve'.


Related Discussions:- Treasury yield curve

State the term- adequate working capital, State the term- adequate working ...

State the term- adequate working capital If a firm doesn't have adequate working capital, that is, it doesn't invest sufficient funds in current assets, it can become illiquid

What is risk aversion, What is risk aversion? If common stockholders are ri...

What is risk aversion? If common stockholders are risk averse, how do you explain the fact that they often invest in very risky companies? Risk aversion is the tendency to evad

Structure and organization of treasury , I am looking for assignment help o...

I am looking for assignment help on the topic Structure and Organization of Treasury. It would be great if anyone help me.

Principle of opportunity cost, Suppose you have recently been contracted as...

Suppose you have recently been contracted as a financial consultant to a London-based engineering company, Alpha Products Plc. The company uses three components as part of their pr

Outline the objectives of alm, You are a member of the ALM Committee (ALCO)...

You are a member of the ALM Committee (ALCO) of ANZ Bank. A visiting member has some queries relating to the general framework of the ALM and interest rate risk impact on the incom

How do financial managers calculate the average tax rate, How do financial ...

How do financial managers calculate the average tax rate? Financial managers calculate the average tax rate by dividing tax dollars paid by earnings before taxes (EBT).

Yield on treasury bills, Treasury Bills, popularly known as T-bills, ...

Treasury Bills, popularly known as T-bills, are issued in India by the RBI on behalf of the Government of India. T-bills are short-term securities with a maturity of 91

Inventory management, A computer products store stocks color graphics monit...

A computer products store stocks color graphics monitors, and the daily demand is normally distributed with a mean of 1.6 monitors and a standard deviation of 0.4 monitor. The lead

Compute the expected return and standard deviation, Question: Consider ...

Question: Consider the following information:   Stock A Stock B Beta 0.8 1.4 Share price, $

Write Your Message!

Captcha
Free Assignment Quote

Assured A++ Grade

Get guaranteed satisfaction & time on delivery in every assignment order you paid with us! We ensure premium quality solution document along with free turntin report!

All rights reserved! Copyrights ©2019-2020 ExpertsMind IT Educational Pvt Ltd